
Figure 1.
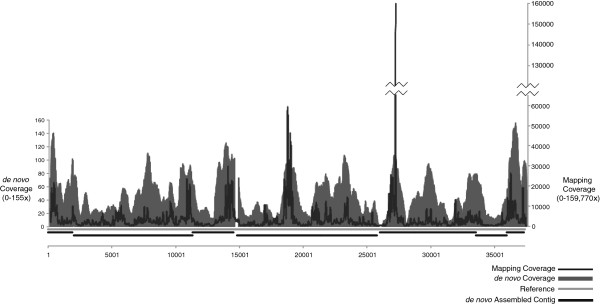
Mapping and de novo assembly coverage sequencing results for the phage SISPA product from 10 pg of genomic DNA. The black lines along the x-axis are the de novo assembled contigs mapped to the reference (light gray line across the x-axis). Coverage for the de novo contigs is shown with dark gray bars in the graph (left y-axis). The coverage from mapping the reads to the reference is represented with a black line (right y-axis).