
Figure 4.
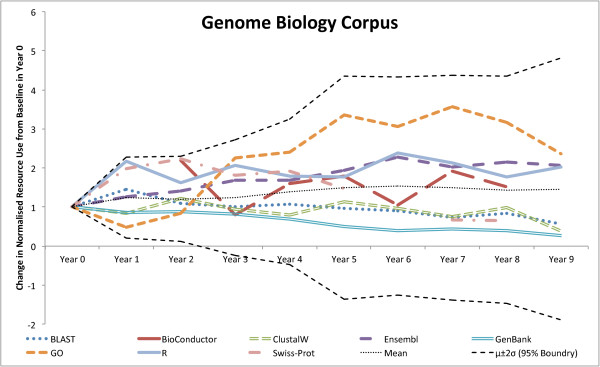
Genome Biology’s upper and lower 95% bounds. Comparison of a resource’s change in relative use, compared to the expected change based on a random walk using a Gaussian distribution fitted to the normalised resource usage changes from a baseline in Year 0 for Genome Biology. The upper and lower 95% bounds are calculated as two standard deviations from the mean.