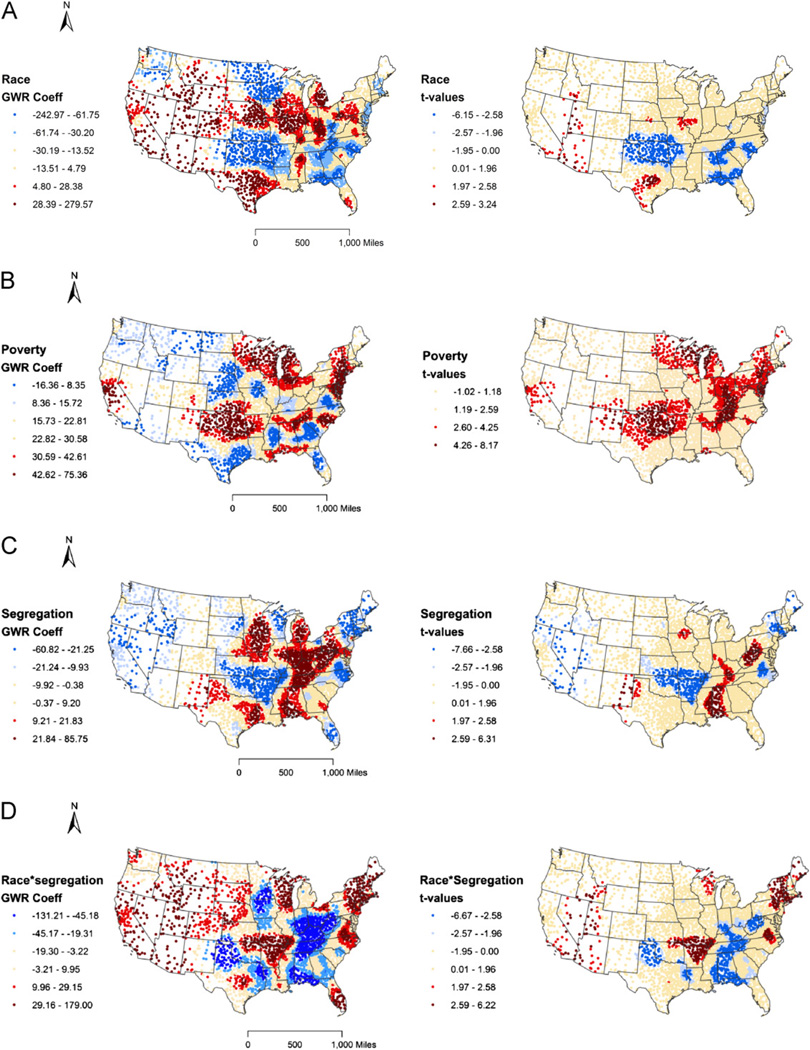
Fig. 2.
(A) Depicts maps of GWR coefficients (left) and t-values (right) from the fully adjusted GWR model 5 for the main effect of race variable (or spatial heterogeneity in racial disparities in CHD mortality after adjusting for poverty and segregation). (B) Depicts maps of GWR coefficients (left) and t-values (right) from the fully adjusted GWR model 5 for the main effect of poverty variable. (C) Depicts maps of GWR coefficients (left) and t-values (right) from the fully adjusted GWR model 5 for the main effect of segregation (or the effect of segregation in whites). (D) Depicts maps of GWR coefficients (left) and t-values (right) from the fully adjusted GWR model 5 for the interaction between race and segregation.

