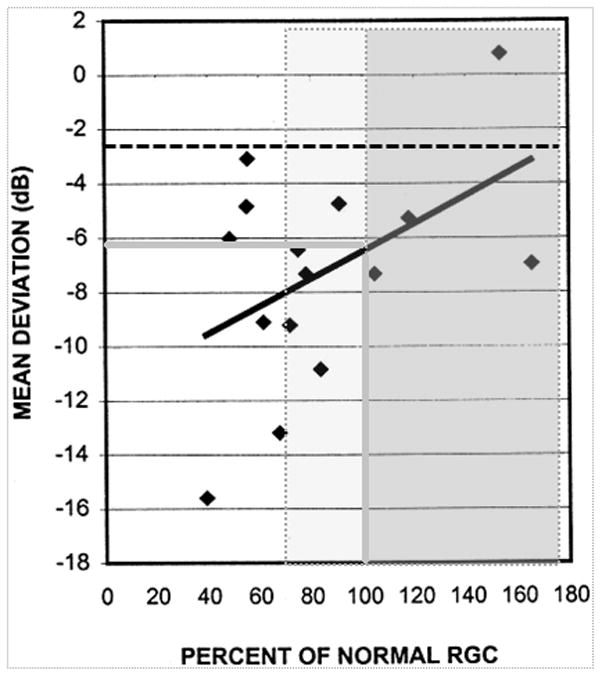
Figure 3. Adapted from Kerrigan-Baumrind et al. (2000) 41.

A percentage retinal ganglion cell (RGC) count of 100% (i.e. mean normal) corresponds to a Mean Deviation, MD, value of nearly −6 dB (solid grey lines). The grey shaded box shows points which correspond to a percentage RGC of 100% or greater (Three of these eyes have a MD of less than −5 dB). The lighter grey shaded box shows additional points which lie have a RGC count of greater than 67% and correspond to points which are statistically within confidence limits for normality (at p=5%, one tailed). The black dotted line corresponds to the MD value corresponding to a (one-tailed) p=5% for their data.
