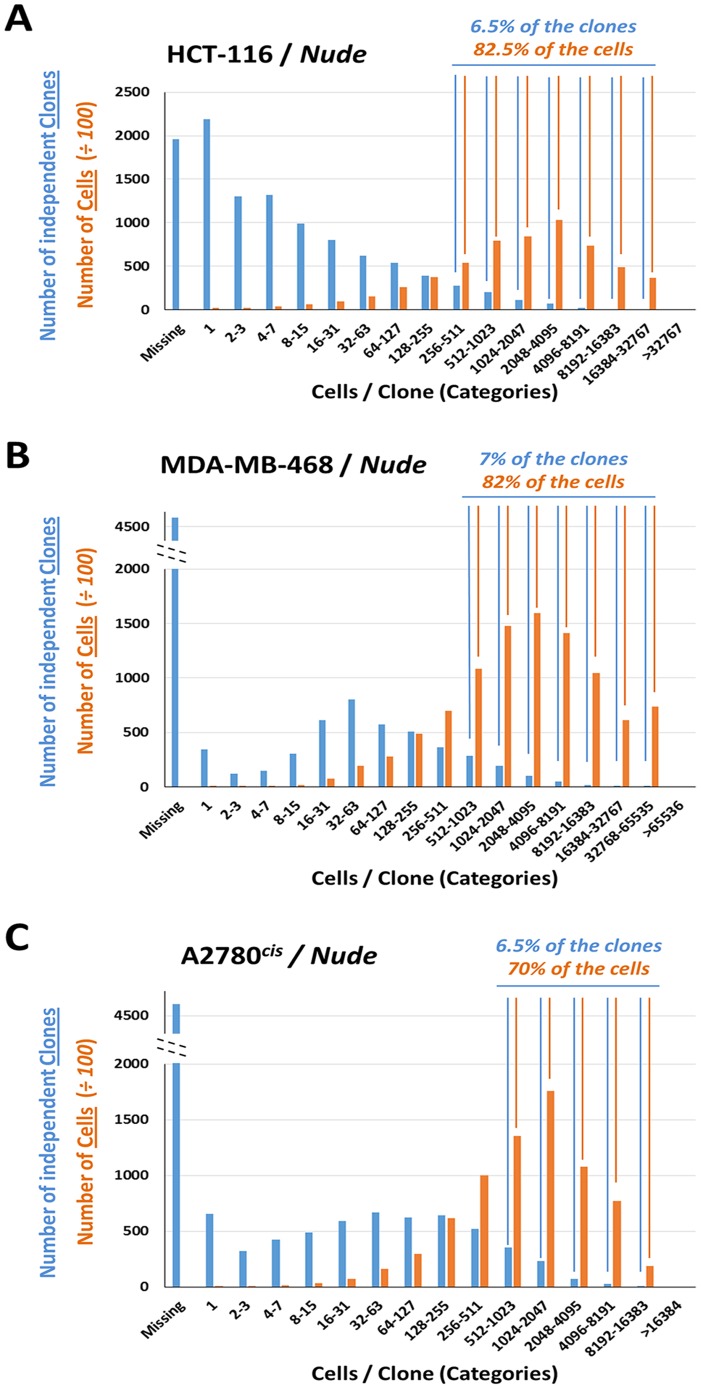
Figure 5. Distributions of HCT-116, MDA-MB-468 and A2780cis barcoded cells upon in vivo growth in Nude mice.
For each graph, the number of independent barcoded clones (blue bars) and the total aggregate number of barcoded cells (orange bars) are plotted for each clone size category across the X axis. (A) Distribution of barcoded HCT-116 cells: 82.5% of the barcoded cells were derived from 6.5% of the initially tagged and injected clones. (B) Distribution of barcoded MDA-MB-468 cells: 82% of the barcoded cells were derived from 7% of the initially tagged and injected clones. (C) Distribution of barcoded A2780cis cells: 70% of the barcoded cells were derived from 6.5% of the initially tagged and injected clones. Scale for number of cells was adjusted 100 fold to allow side by side comparisons of clone numbers and cell numbers.

