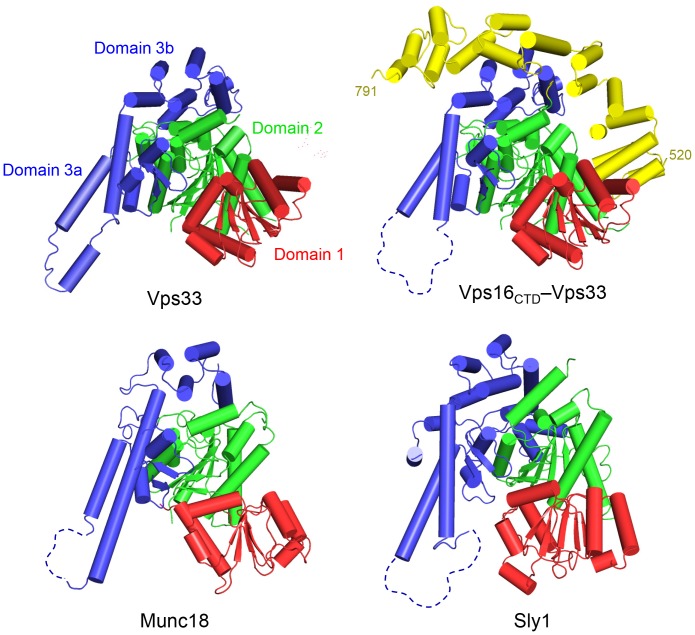
Figure 1. SM protein family comparison.
Vps33, Vps16CTD–Vps33, rat Munc18–1 (PDB entry 3PUJ), and Sly1 (1MQS) are shown with cylinders representing α-helices. The different position of domain 1 in Vps33, relative to Munc18–1 and Sly1, is especially notable. The tip of domain 3a shows varying degrees of disorder, as discussed in the text.

