Figure 2.

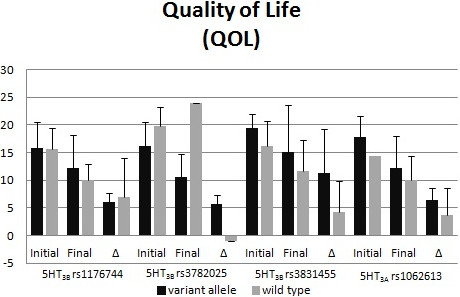
Comparison of QOL scores by Serotonin receptor genotype. Initial and final scores and the change (Δ) in the score are reported for 4 different single nucleotide polymorphisms. Given as Mean ± Standard Deviation.

Comparison of QOL scores by Serotonin receptor genotype. Initial and final scores and the change (Δ) in the score are reported for 4 different single nucleotide polymorphisms. Given as Mean ± Standard Deviation.