Figure 1.
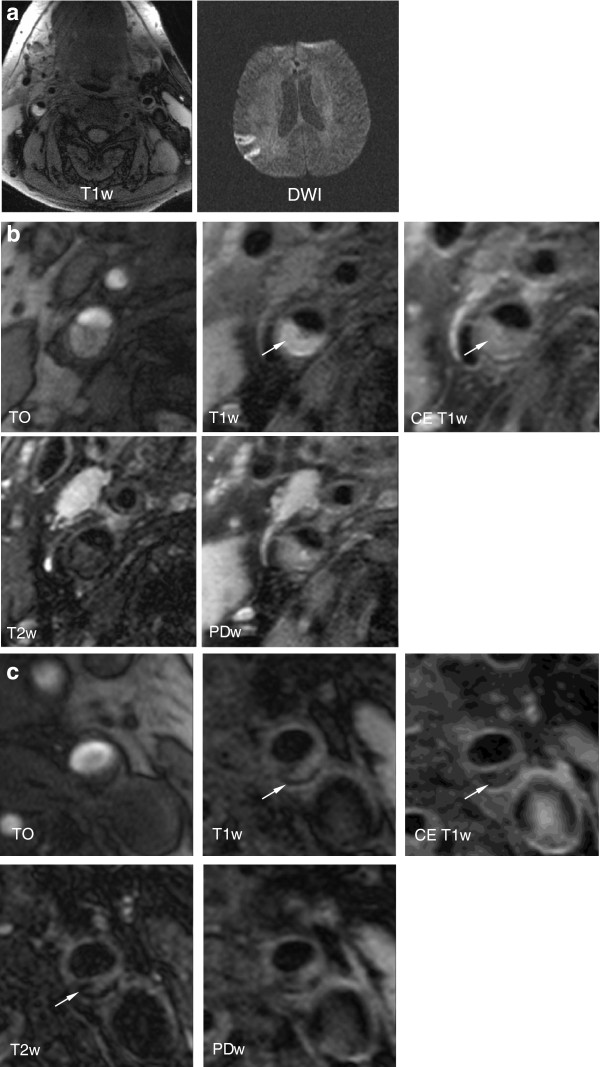
Imaging example. Figure 1 shows various CMR-images of a 66 years old patient who suffered an infarction 4 days before the CMR scan. a. T1w and DWI MR-images of the patient. Axial T1w images with fat suppression demonstrate atherosclerotic lesions in both internal carotid arteries (ICA). The lesion in the right ICA, ipsilateral to the symptoms, is hyperintense, consistent with intraplaque hemorrhage. The lesion in the left ICA is hypo- to isointense, consistent with a fibrous and calcified lesion. Axial DWI images show a diffusion restriction in the posterior part of the right middle cerebral artery, consistent with an acute brain infarction. b. Axial multi-sequence CMR images of the same patient demonstrating the complicated AHA lesion type VI plaque ipsilateral to the stroke in the right ICA. The arrow points to a region which is hyperintense on T1w and TOF images and hypointense on PDw and T2w images, consistent with type I hemorrhage into a large necrotic core. The dark band on TOF images is disrupted, the hyperintense area on TOF is located juxtaluminally and the fibrous cap cannot be visualized in the contrast enhanced T1w images, indicating rupture of the fibrous cap (ICA = Internal carotid artery, TOF = Time-of-Flight). c. Axial multi-sequence CMR images of the same patient demonstrating the uncomplicated AHA lesion type VII plaque contralateral to the stroke in the left ICA. The arrow points to a region which is hypointense on all images, consistent with a calcification, surrounding an area which is isointense to fatty tissue in T1w, T2w and PDw images and shows no contrast enhancement, consistent with a necrotic lipid core. The contrast enhancing fibrous cap separating the plaque from the lumen appears intact. (ICA = Internal carotid artery, TOF = Time-of-Flight).

