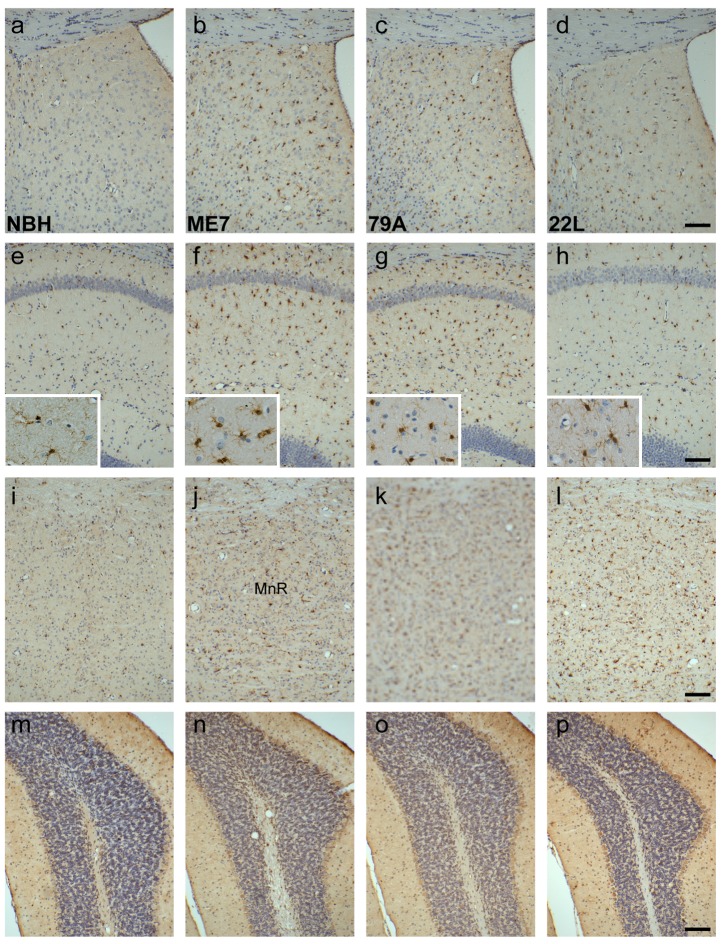
Figure 4. IBA1 positive microglia increase and have an activated morphology in prion animals.
a–d) Compared to the sparse, uniform distribution of microglia in NBH animals, the lateral septum, dorsal part, shows an increased expression in the prion strains (4a vs. 4b-d). e–h) CA1 of the hippocampus shows a large increase of microglia with activated morphology (insets) in the ME7 and 79A strains, with a more modest increase in the 22L strain (4e vs. 4f-h). i-l): The median raphe has increased microglia in all strains (4i vs. 4j-l). m–p) microglia levels were similar in all treatment groups. Scale bars = 100 µm.

