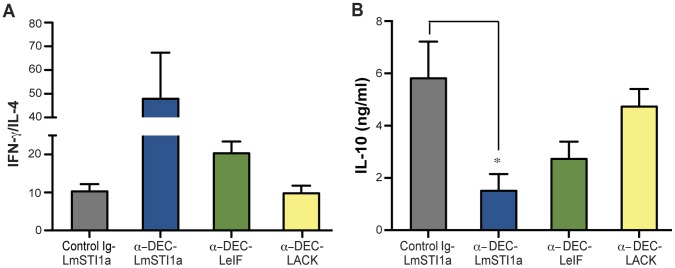
Figure 6. Analysis of the cytokine responses after challenge with L. major.
As in Figure 5, but 12 weeks after infection with L. major, total cell suspensions of ear-infected draining LN were restimulated in vitro for 72 h with 10 µg/ml of SLA. The levels of IFN-γ, IL-4, and IL-10 cytokines in the culture supernatants were determined by ELISA. Data is shown as the mean ± SEM of the ratio of (A) IFN-γ/IL-4 and (B) IL-10 (n = 4–10).

