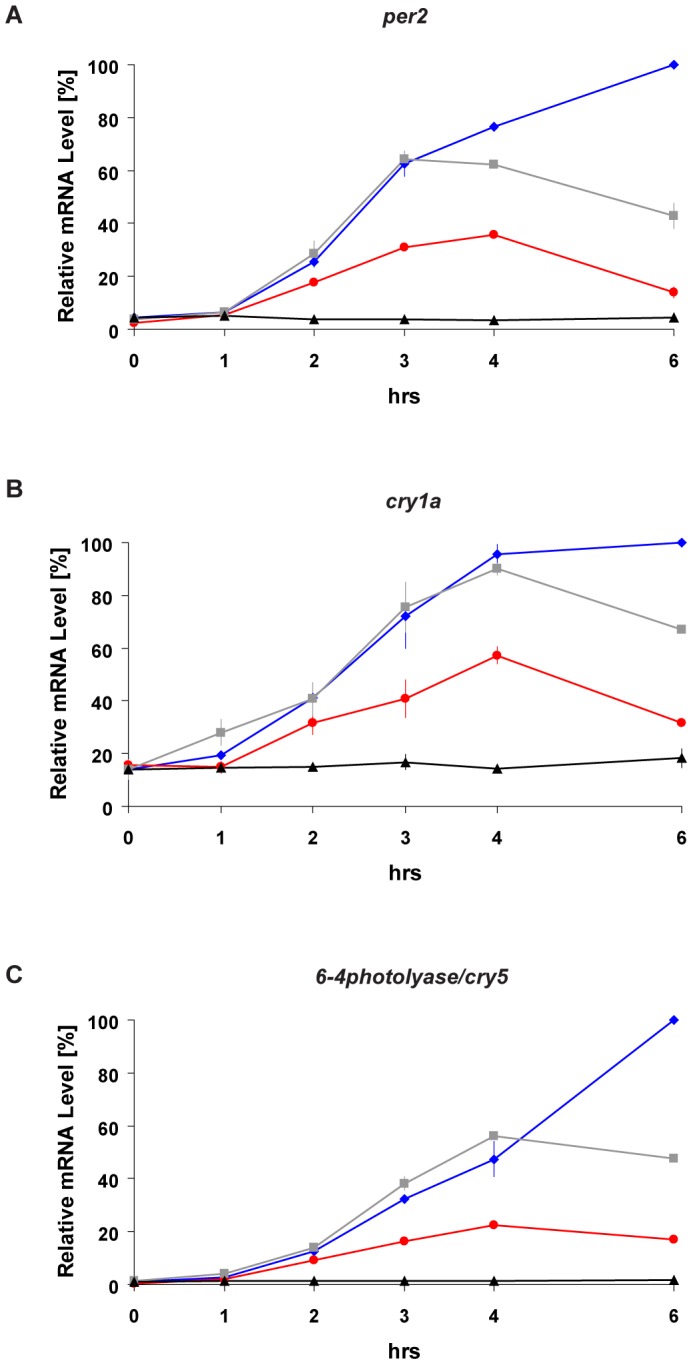
Figure 1. Activation of light-inducible genes by blue, red and white light.

(A–C) Quantitative RT-PCR analysis (qRT-PCR) of light inducible genes in PAC-2 cells during constant darkness conditions (DD controls, black traces), white (grey traces), blue (blue traces) or red (red traces) light exposure. Total RNA was extracted from cells that were maintained in DD (control) or illuminated with the various light sources for different time periods (0, 1, 2, 3, 4, 6 hrs). Each gene is indicated above its respective panel. Relative mRNA levels (%) are plotted on the y-axis where the highest value measured during each experiment (Blue light exposure for 6 hours) is set as 100%. Time (hrs) is plotted on the x-axes. In each panel, points are plotted as the means of three independent experiments +/−SD. The results of statistical analysis are presented in Figure S1A–B.
