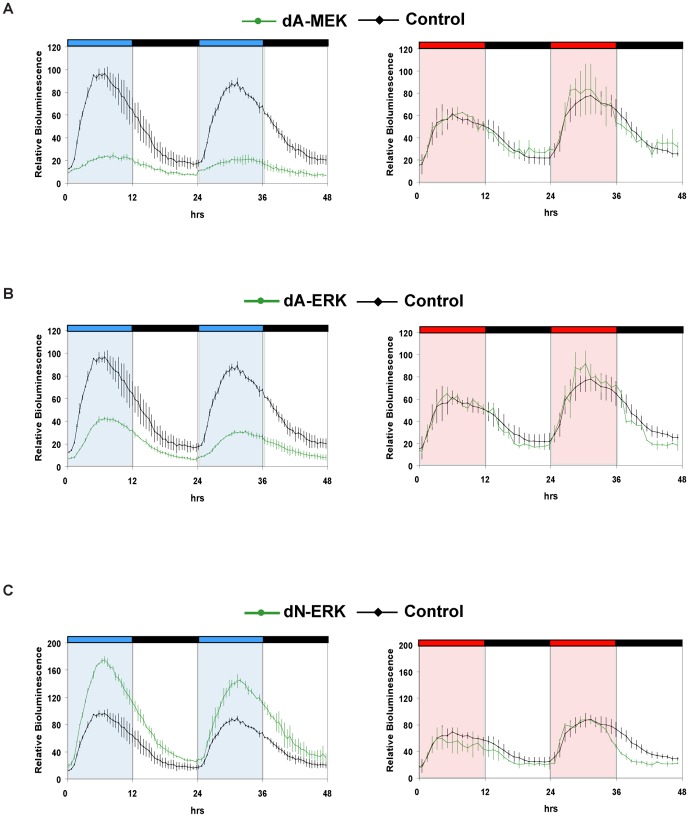
Figure 5. Impact of dominant active and dominant negative forms of MEK and ERK on D-box driven expression.
Real time bioluminescence assays of PAC-2 cells co-transfected with D-boxcry1a-Luc and either dA-MEK (A), dA-ERK (B), dN-ERK (C) (green traces) or an empty expression vector control (A–C, black traces). In each panel, relative bioluminescence (%) is plotted on the y-axis where the highest value measured in the control (reporter construct alone) cells during each experiment is set as 100% and time (hrs) is plotted on the x-axis. Each time-point represents the mean of three independent experiments +/−SD. The results of statistical analysis are presented in Figure S1H. Blue, red and black bars above each panel represent the lighting conditions. For clarity, blue, red and white background also indicates the blue, red and dark periods, respectively. See Figure S4 for characterization of the various recombinant MAPK constructs.

