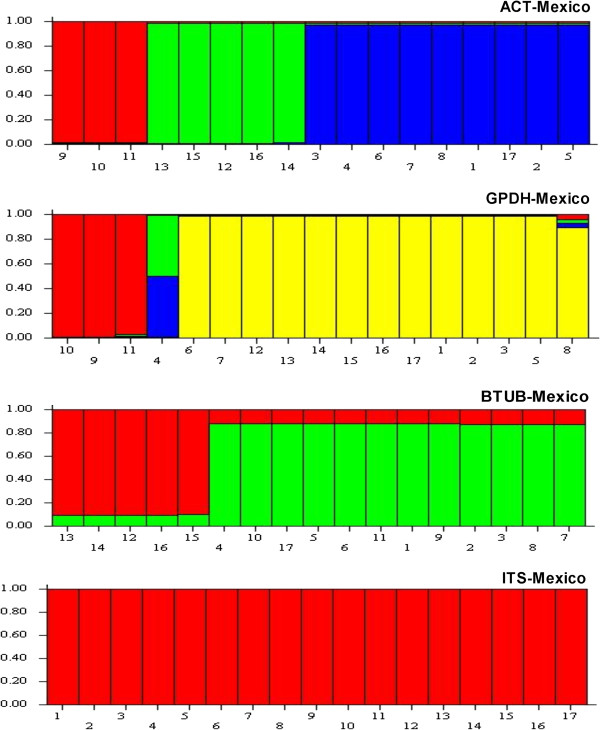
Figure 3.
Bar plot shows Q (estimated membership coefficients by posterior probability) for each gene region for the Mexico population of Colletotrichum gloeosporioides sensu lato. The height of each region within an individual bar is the measure of proportional affiliation. Individuals with membership coefficients of qi ≥ 0.7 were assigned to a specific genetic cluster.

