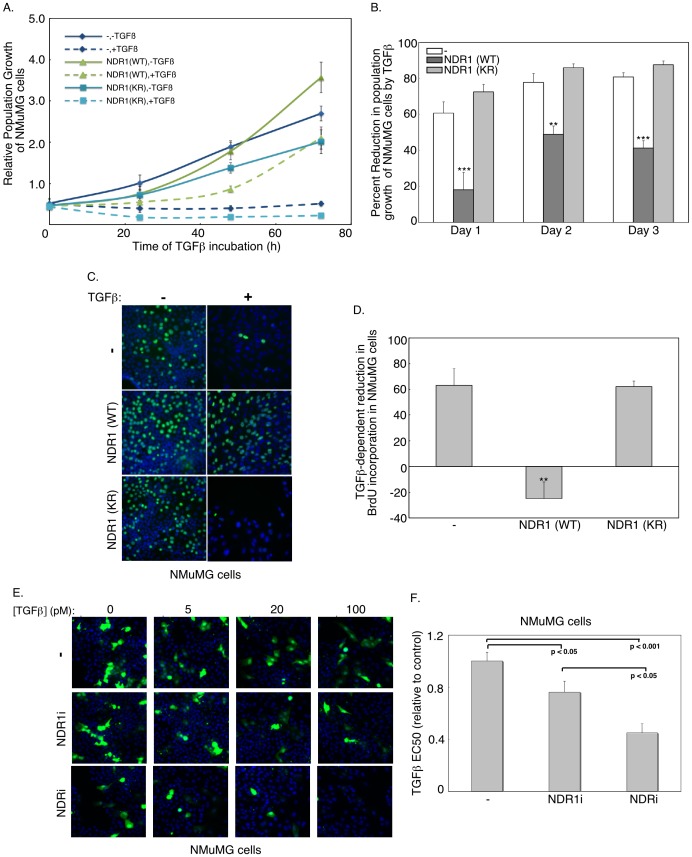
Figure 4. NDR1 suppresses TGFβ-repression of cell proliferation.
A. Population growth curves of NMuMG cells expressing wild type (WT) or kinase-inactive (KR) NDR1 or the vector control (−) analyzed using phase-contrast microscopy after one, two or three days of culturing in the absence (solid lines) or presence (broken lines) of TGFβ. Each point is the mean±SEM (n = 7) of cell population normalized to cell population seeding. B. The effect of TGFβ on cell population growth curves for NMuMG expressing NDR1 or the vector control as in A was analyzed as the difference of untreated and TGFβ-treated cell populations as a percent of untreated cell counts. Each point is the mean+SEM (n = 7) of the percent decrease in population growth by TGFβ. C. Representative fluorescence microscopy images of untreated or 48h-TGFβ-treated NMuMG cells expressing wild type or kinase-inactive NDR1 or the vector control that were incubated for 1 h with bromodeoxyuridine (BrdU) and subjected to indirect immunofluorescence using the BrdU antibody and a Cy2-conjugated secondary antibody (green), and labeling with the DNA Hoechst dye (blue) D. For each cell type as in C, percent reduction of BrdU-labeled cells in response to TGFβ was quantified as in B. Data are presented as the mean+SEM (n = 3) of the percent reduction in BrdU incorporation in cells in response to TGFβ. E. Representative fluorescence images of GFP-expressing (green) and DNA dye (Hoechst) (blue)-labeled NMuMG cells transfected with control RNAi plasmid or the combination of NDR1i-1 and NDR1i-2 (NDR1i) RNAi plasmids alone or together with the combination of NDR2i-1 and NDR2i-2 RNAi (NDRi) plasmids, and incubated one day post transfection with 0, 5, 20 and 100 pM TGFβ for 36 h. F. A target activation algorithm accompanying the Cellomics KSR instrument used to capture images including those shown in E was used to determine population growth of GFP-positive cells in 96 well plates. For each experiment, triplicate average population growth of GFP-positive cells was plotted versus TGFβ concentration and fitted using log transformation to obtain the effective concentration of TGFβ leading to 50% reduction of population growth of GFP-expressing cells (EC50). Data are presented as the mean+SEM of EC50 values expressed relative to the NMuMG cells transfected with the vector control from six (- and NDRi) or five (NDR1i) independent experiments. The width of each fluorescence micrograph in C and E corresponds to 330 µM. **, or *** indicates significant difference from the control at p<0.01, or p<0.001, respectively (ANOVA).

