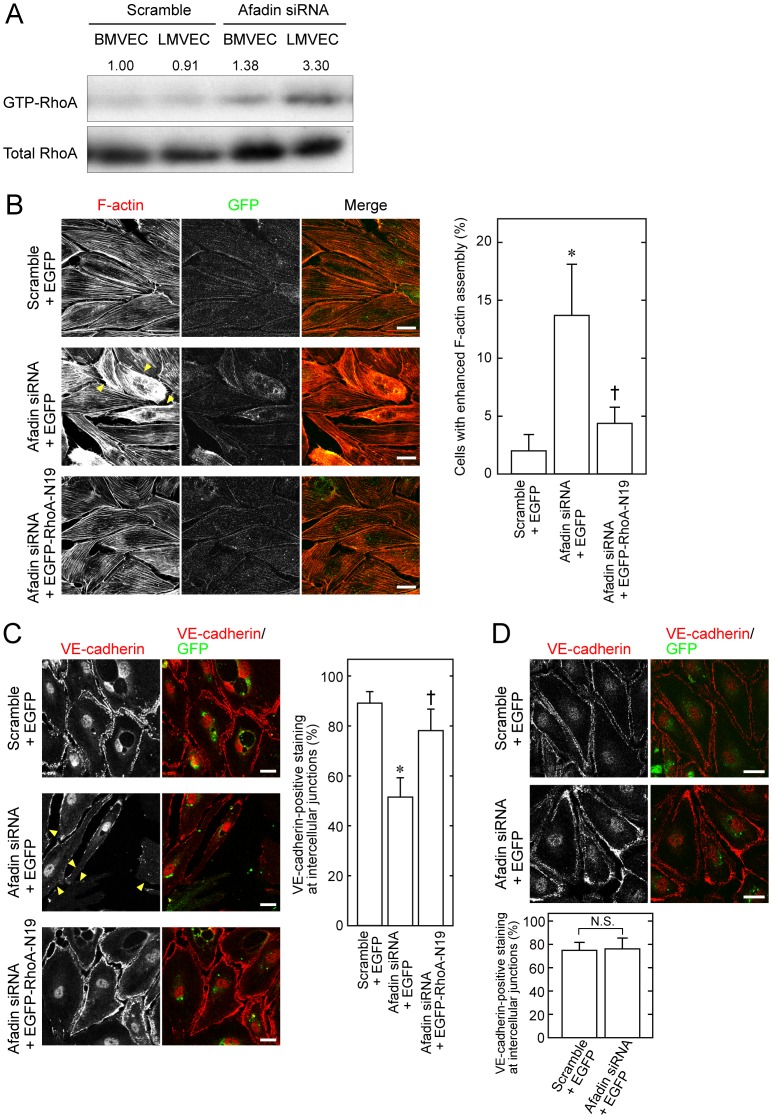
Figure 5. Enhanced activation of RhoA in LMVECs by inactivation of afadin.
(A) Activation of RhoA in BMVECs and LMVECs. At 2 days after transfection of siRNA or scramble RNA, BMVECs and LMVECs were lysed and then used for the pull-down assay, followed by western blotting with an anti-RhoA pAb. The numbers above the blot represent the relative density of GTP-bound RhoA normalized to the total amount of RhoA by comparing the value of BMVECs transfected with scramble RNA, which is expressed as 1.00. (B, C) Restoration of cell morphology and VE-cadherin-mediated cell-cell junctions by introduction of dominant-negative RhoA in afadin-knockdown LMVECs. LMVECs transfected with the indicated combination of siRNA, scramble RNA, pEGFP and pEGFP-RhoA-N19 were labeled with rhodamine-phalloidin to visualize F-actin (B) and with an anti-VE-cadherin mAb (C). Arrowheads indicate enhanced F-actin assembly (B) and reduced VE-cadherin staining (C). (D) VE-cadherin-mediated cell-cell junctions in control and afadin-knockdown BMVECs. BMVECs transfected with scramble RNA + pEGFP or siRNA + pEGFP were immunostained with an anti-VE-cadherin mAb. Bar graphs show the percentage of cells with VE-cadherin staining at cell-cell junctions. Bar graphs in B, C and D show the percentage of cells with enhanced F-actin assembly (B) and with VE-cadherin staining at cell-cell junctions (C) and (D). Error bars indicate the mean ±S.D. from at least three independent experiments. *, p<0.01 vs. Scramble +EGFP, and †, p<0.01 vs. Afadin siRNA +EGFP. N.S., not statistically significant. Scale bars represent 20 µm.

