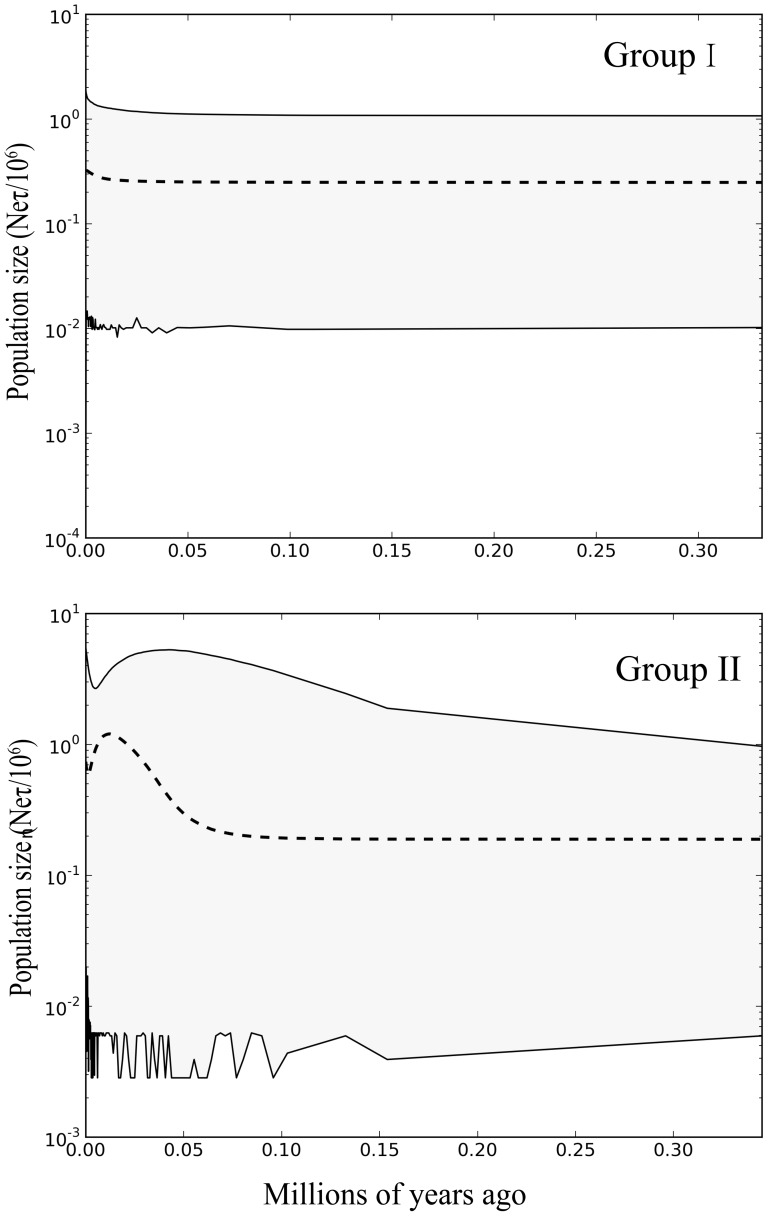
Figure 3. Extended Bayesian skyline plots showing the demographic trends in Groups I and II of Calotes versicolor.
The x-axis is in units of million years ago and the y-axis represents the estimated population size on a log scale (Neτ/106, the product of the female effective population size and generation length in years). The central line shows the median estimate of effective population size, while dashed lines represent the 95% credibility limits.

