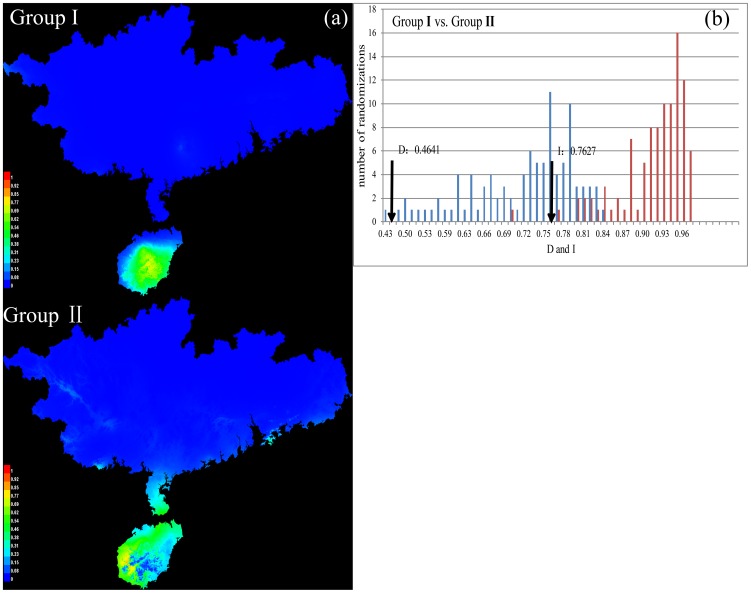
Figure 4.
(a) Predicted distributions of Groups I and II generated in Maxent. (b) The results of a niche identity test. Blue columns indicate the null distribution of D, which measures the similarity of two niches. Red columns indicate the null distribution of I, which is an measure of similarity based on the probability distributions of two ecological niche models. The x-axis indicates the value of D and I, whereas the y-axis shows the number of randomizations. The arrow indicates the value in actual Maxent runs.

