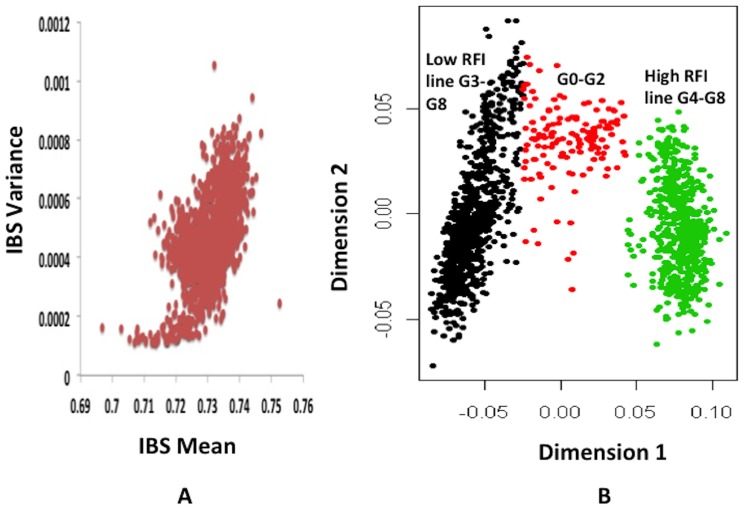
Figure 2. Clustering of the residual feed intake (RFI) population by the PLINK software.
Figure A indicates identical-by-state (IBS) clustering. The X and Y axes represent IBS mean and IBS variance. Figure B shows multi-dimensional clustering. The X and Y-axes indicate dimensions 1 and 2, respectively. The black color cluster includes animals from generations 3–8 of the Low RFI line, the green cluster includes animals from generations 4–8 of the High RFI line, and the red cluster includes animals from generations 1 and 2 of the Low RFI line and generation 0, which is the founder population from which RFI selection lines originated.

