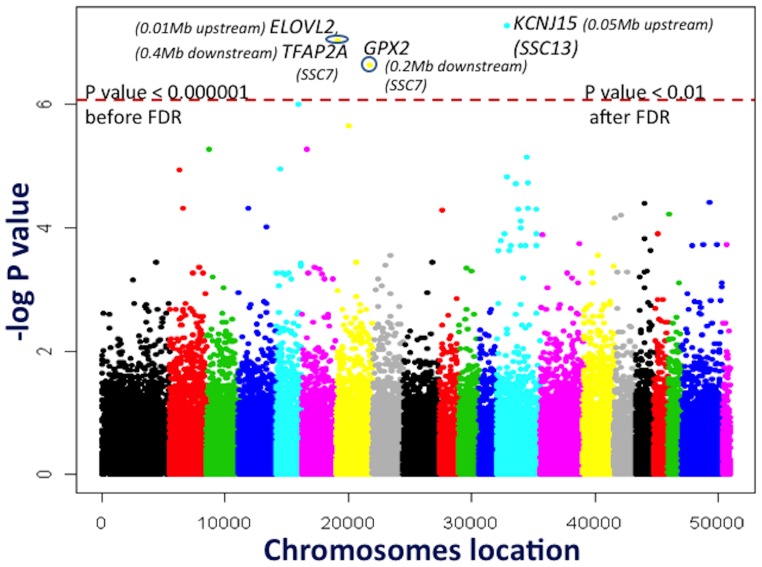
Figure 3. Allele frequency differences between the Low and High residual feed intake lines at generation 8.
The X axis indicates in different colors from left to right, SNP locations from chromosomes 1 to X, unassigned contigs, Y, and completely unmapped SNPs, using Sus scrofa genome build10.2. The Y axis represents the minus log of the P-value for the allele frequency difference between the two lines for each SNP,. The dashed line shows the P-value threshold. SSC: Pig chromosome; FDR: False discovery rate; KCNJ15: Potassium inwardly rectifying channel, subfamily J, member 15; ELOVL2: Elongation of very long chain fatty acids 2; TFAP2A: Transcription factor AP-2 (Activating enhancer binding protein 2)—alpha; GPX2: Glutathione peroxidase 2.

