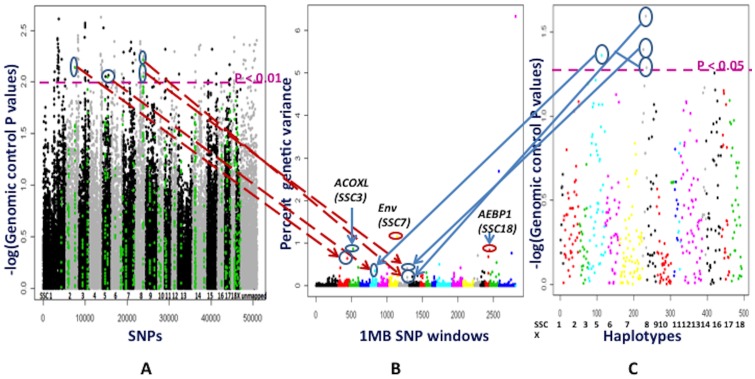
Figure 8. Whole genome association studies for back fat (BF).
Part A depicts association analyses performed by the PLINK software for each SNP. The X axis shows SNPs across chromosomes SSC1 to X, unassigned cintigs, Y and completely unmapped SNP. The Y axis contains the negative logarithm of the P values adjusted for genomic control. Each spot is a SNP. The green color SNPs are those located in 1 Mb window regions that explain more than 0.2% of genetic variance in part B. Part B illustrates results from the Bayes B model averaging approach used in the Gensel software. Different colors on the X axis indicate genome wide 1 Mb SNP windows from chromosome 1 to X, unassigned contigs and completely unmapped SNP. The markers from completely unmapped and unassigned contigs were not included in the cumulative genetic variance. The Y axis represents percent genetic variance explained by each 1 Mb window. Part C shows association analyses with the PLINK software based on haplotypes, which were derived for 1 Mb windows that explained a higher than 0.2% of genetic variance in part B. The X axis has haplotypes on specific chromosomes. The Y axis shows the negative logarithm of the P values corrected by genomic control. The arrows in parts A, B and C show the similarities in significant locations of the associated SNPs, SNP windows and their haplotypes. The 1 Mb windows that explained higher than 0.2% percent genetic variance in Gensel analyses and/or were significant in the PLINK analyses were considered to be important putative QTL for BF. ACOXL: acyl-coenzyme A oxidase-like; AEBP1: adipocyte enhancer binding protein 1; Env: envelope protein.

