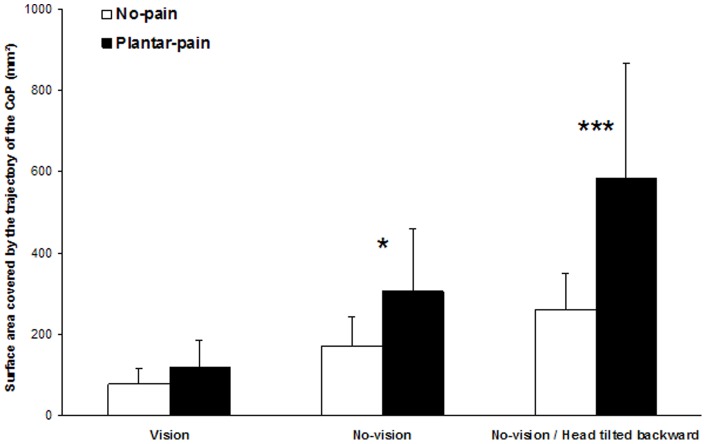
Figure 1. Mean and standard deviation of the surface area covered by the trajectory of the CoP obtained for the three sensory conditions and the two pain conditions.
The No-pain condition is represented by white bars and the Plantar-pain condition by black bars. The significant P values for comparison between No-pain and Plantar-pain conditions are reported (*: P<0.05; ***: P<0.001).

