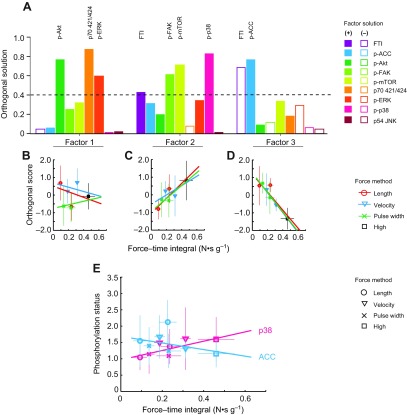
Fig. 8.
(A) Component contributions to the three factors identified by factor analysis of the force–method data set. Bars with a positive (filled) or negative (open) loading greater than 0.4 indicate primary components of that factor. Regression plots of Factor 1 (B), Factor 2 (C) and Factor 3 (D) against FTI. (E) Regression of major components of factor 2 and 3 against FTI (p38: P=0.043; ACC: P=0.21).

