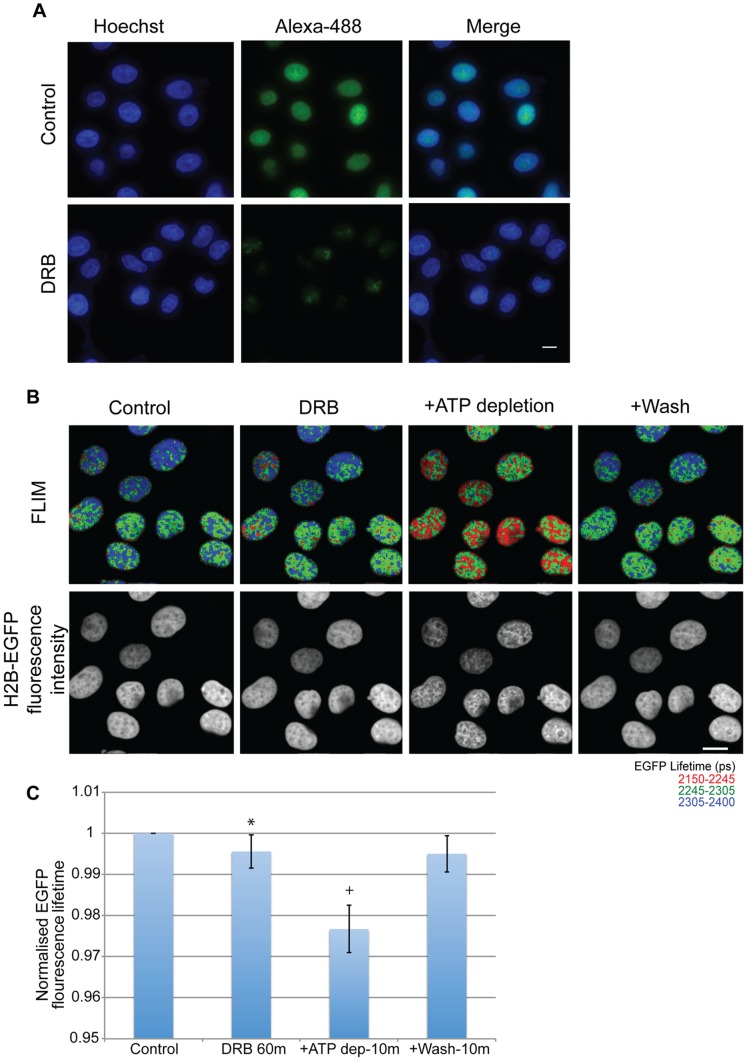
Figure 2. Transcription inhibition does not lead to a drastic increase in chromatin compaction.
(A) the panel shows HeLa cells with nuclear (Hoechst) and nascent RNA (Alexa-488) staining (pulse labeled with EU for 30 m). The upper panel shows control cells and the lower panel shows cells treated with DRB at a concentration of 25 µg/ml for 60 minutes. (Scale bar-10 µm) (B) FLIM images showing a decrease in fluorescence lifetime upon ATP depletion for 10 minutes in cells treated with DRB at a concentration of 25 µg/ml for 60 minutes, which is reversed upon washing away of the drugs. The resulting chromatin compaction is evident from the Intensity images of H2B-GFP fluorescence. (Scale bar-10 µm) (C) The chart shows the averaged normalised fluorescence lifetime values of each of the cells upon treatment. Error bars indicate standard deviation for values from 18 nuclei from 3 replicates. (* p-value = 0.0002,+p-value = 3.7×10⁻¹²).

