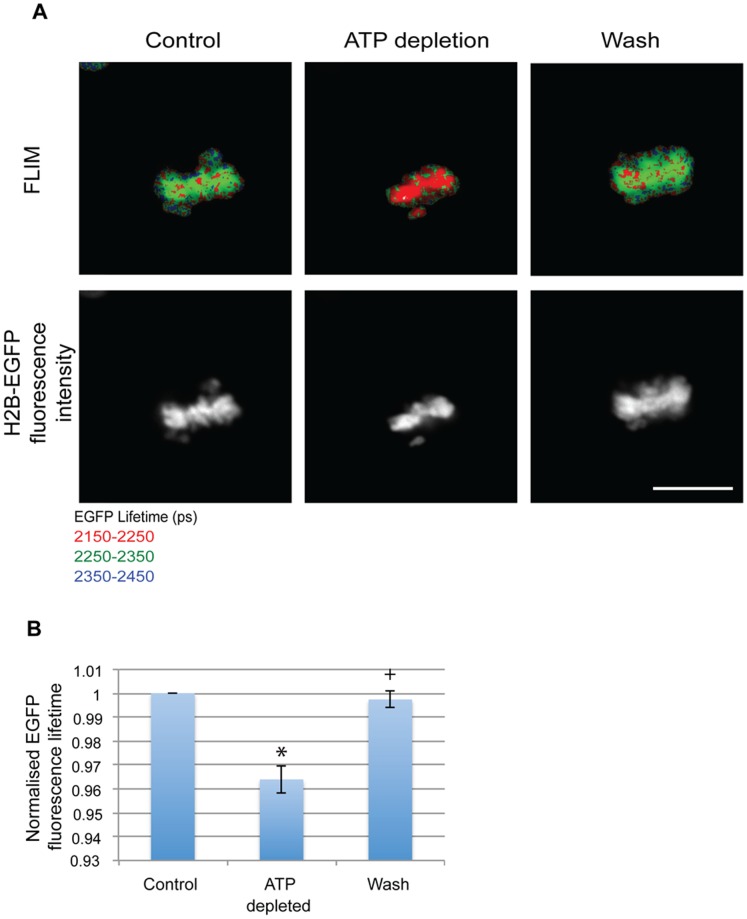
Figure 3. Mitotic chromatin compacts with ATP depletion.
(A) FLIM images showing a decrease in EGFP fluorescence lifetime on ATP depletion and its subsequent increase to control levels when the drugs are washed away in HelaH2B-2FP cells (Scale bar - 10 µm). (B) Chart showing the average EGFP fluorescence lifetime normalised to control values from 9 mitotic cells acquired from 7 individual experiments showing changes upon ATP depletion and repletion. Error bars indicate standard deviation. (* p-value = 3.7×10⁻⁶,+p-value = 0.144).

