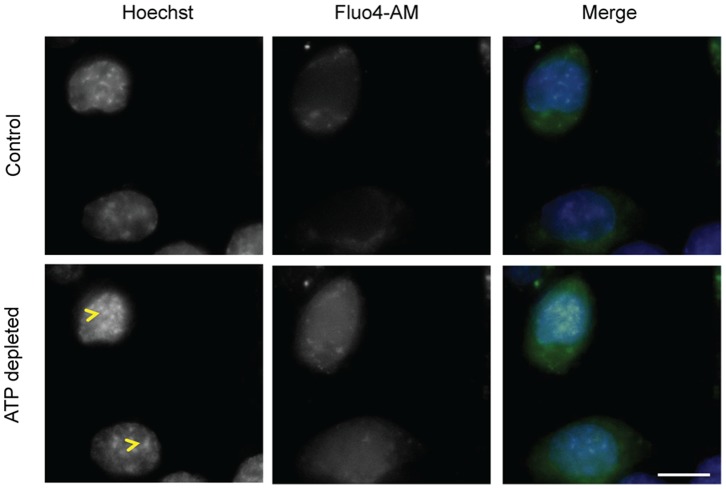
Figure 4. ATP depletion leads to an increase in intracellular free calcium levels.
Fluo4-AM loaded HeLa cells were imaged before and after ATP depletion. The increase in fluorescence indicates an increase in free intracellular calcium levels (p-value = 0.0001). The increase in chromatin compaction (yellow arrow head) can be seen from Hoechst staining after ATP depletion. (Scale bar –10 µm).

