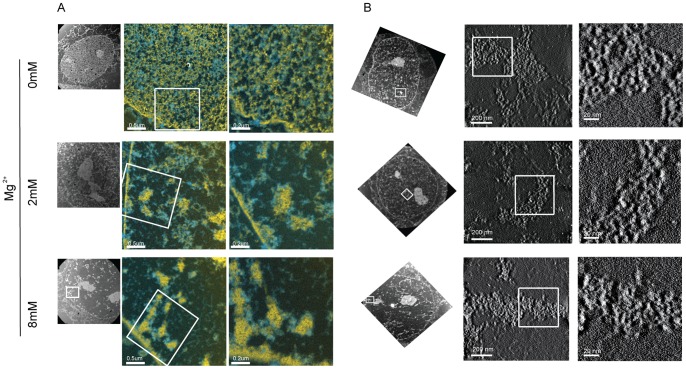
Figure 6. Electron spectroscopic imaging of permeabilised cells showing increased chromatin compaction with increase in Ca2+ concentration.
(A) Electron spectroscopic imaging showing chromatin in yellow and non chromosomal proteins in blue of permeabilised HeLa cells containing varying levels of Mg2+ ions. (B) ESI combined with tomography showing the three dimensional structure of the chromatin of permeabilised HeLa cells containing varying levels of Mg2+ ions.

