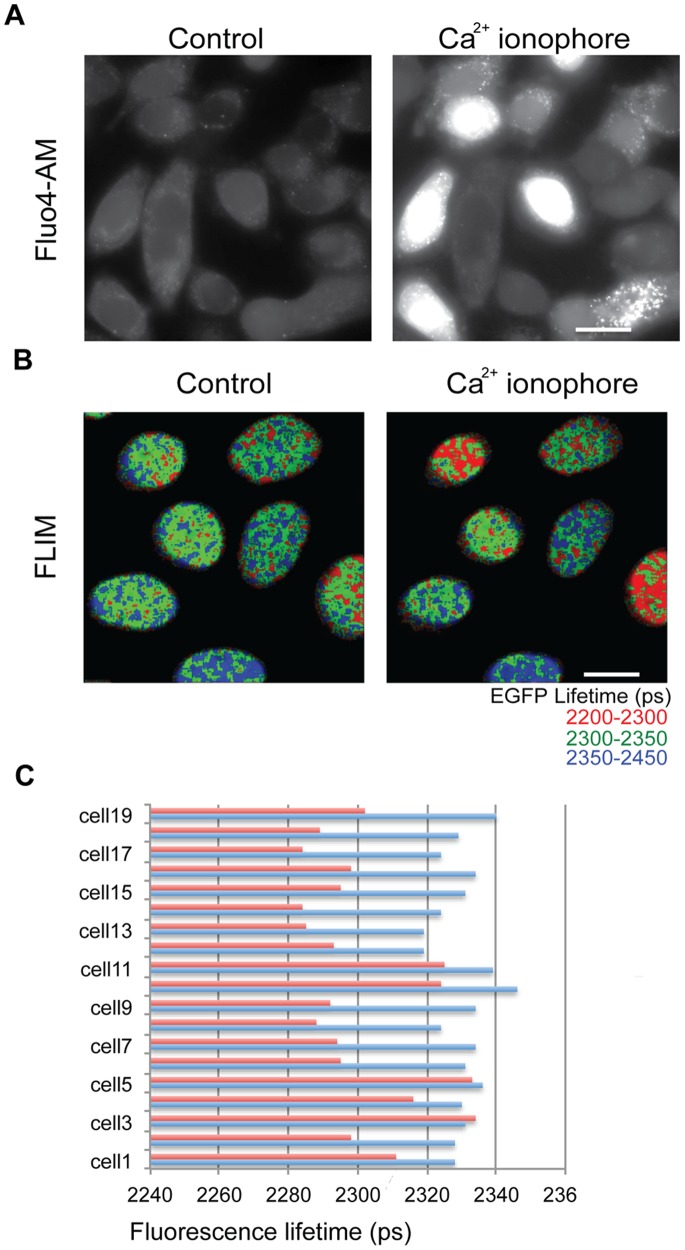
Figure 7. Increasing calcium concentration in live cells leads to an increase in chromatin compaction.
(A) Fluo4 fluorescence images showing an increase in free intracellular calcium levels on treating the cells with Ca2+ ionophore. (B) FLIM images showing a decrease in fluorescence lifetime of HelaH2B-2FP cells that have been treated with Ca2+ ionophore. (C) Chart showing the mean lifetime values of individual HelaH2B-2FP cells before (blue) and after treating with Ca2+ ionophore. (Scale bar –10 µm).

