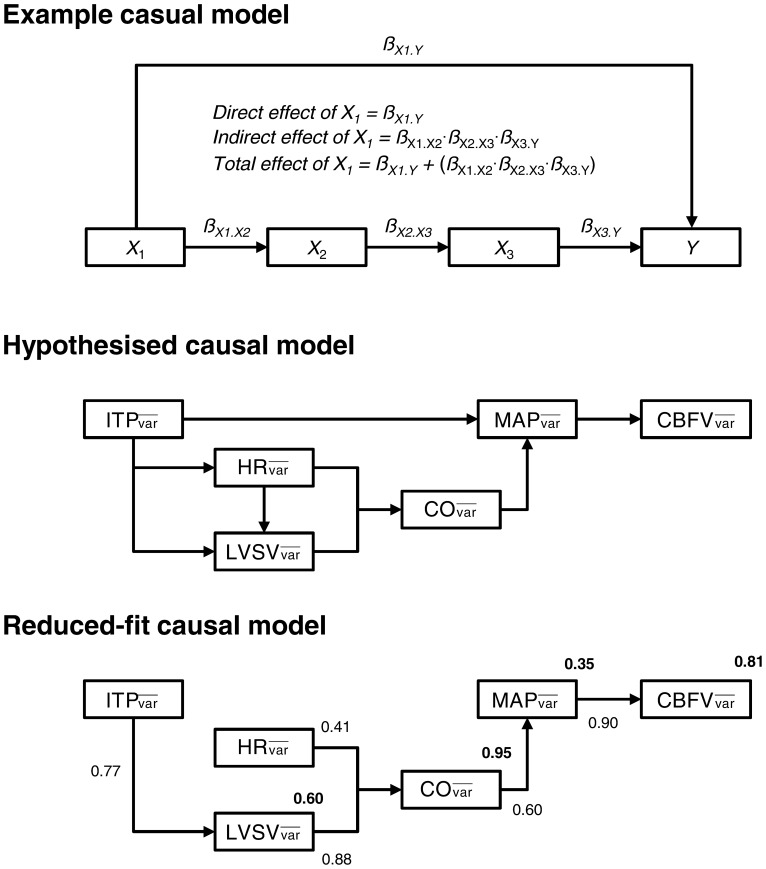
Figure 2. Path analysis.
 : mean variability observed in the corresponding parameter during the struggle phase; ITP: intrathoracic pressure; HR: heart rate; LVSV: left ventricular stroke volume; CO: cardiac output; MAP: mean arterial blood pressure; TPR: total peripheral resistance; CVRi: cerebrovascular resistance index; CBFV: cerebral blood flow-velocity. The top panel depicts a hypothetical Path model to illustrate the direct and indirect effects of each parameter (X
1, X
2 and X
3) on the terminal endogenous variable (i.e., Y). The symbol ß represents the standardised path coefficient describing the influence of one variable on another. See Methods for further explanation. The hypothesised causal model used to examine the influence of respiratory contractions on the respiratory variability in cerebral blood flow velocity is displayed in the middle-panel. The ‘reduced-fit’ causal model is presented in the bottom-panel. Only those parameters which were identified as significant (P<0.05) mediators of the terminal dependent variable (i.e.,
  ) are retained in this panel. Solid arrows denote the direction of causality between corresponding parameters. Values located adjacent to arrows represent the standardised coefficient of the corresponding path. Values displayed in bold represent the coefficient of determination (R
2) of the relationship between the corresponding parameter and all preceding paths.

