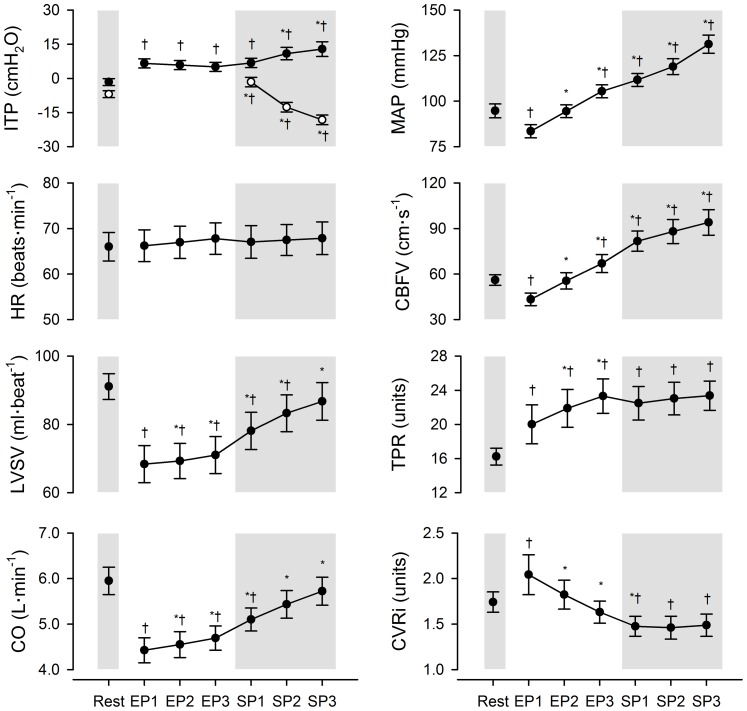
Figure 3. Time-course changes in respiratory, cardiovascular and cerebrovascular variables at rest and during maximal apnoea.
Vertical error bars represent means ± SEM. EP1, EP2 and EP3: first, second and third tertiles of the easy-going phase; SP1, SP2 and SP3: first second and third tertiles of the struggle phase; ITP: intrathoracic pressure; HR: heart rate; LVSV: left ventricular stroke volume; CO: cardiac output; MAP: mean arterial blood pressure; CBFV: cerebral blood flow-velocity; TPR: total peripheral resistance in units of mmHg⋅L−1⋅min; CVRi: cerebrovascular resistance index in units of mmHg⋅cm−1⋅s. The closed and open circles in the top left-hand panel represent expiratory and inspiratory ITP swings, respectively. *Significantly different from previous time-point, P<0.05. †Significantly different from resting value, P<0.05.

