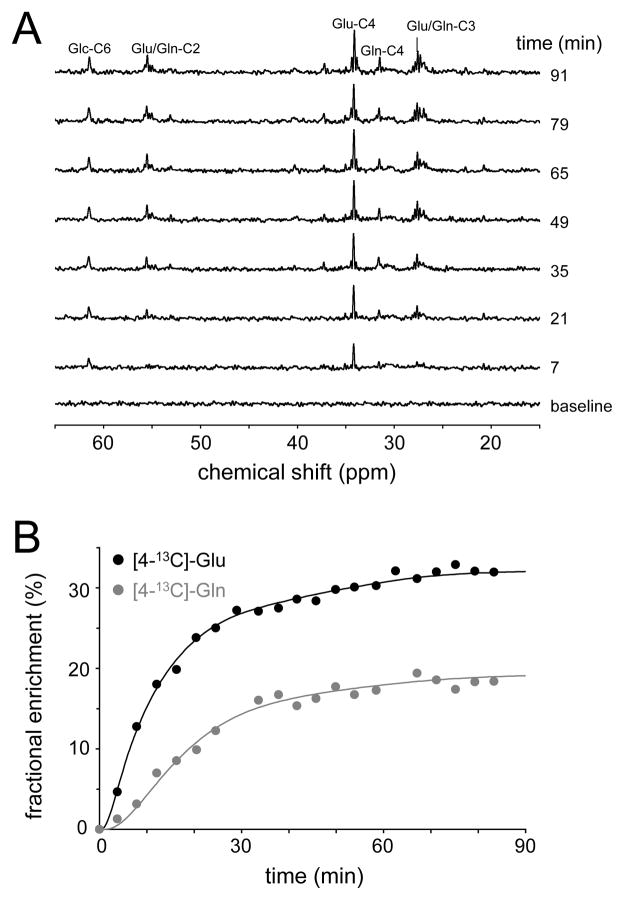
Figure 14.
(A) Time resolved 1H-decoupled, 13C NMR spectra from rat brain in vivo following the intravenous infusion of [1,6-13C2]-glucose. Spectra are acquired with an adiabatic INEPT sequence (TR = 4000 ms, 200 uL) at 7.05 T. (B) Turnover curves of [4-13C]-glutamate and [4-13C]-glutamine. Dots represent measured fractional enrichments as obtained through spectral quantification of the data shown in (A), whereas the solid line represents the best mathematical fit to a three-compartment (blood, glutamatergic neurons and astroglia) metabolic model.

