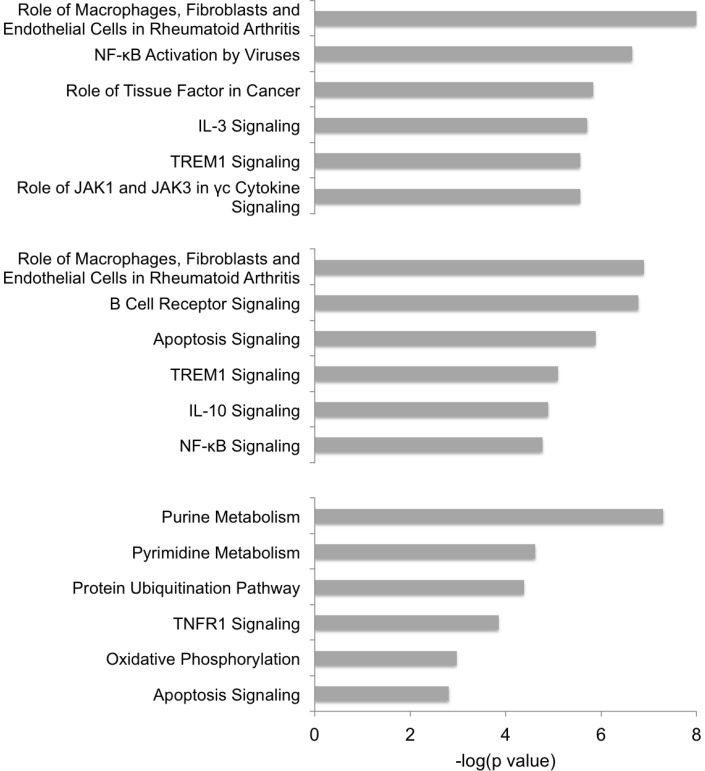
Figure 6. Enrichment in canonical pathways.
Enriched Canonical Pathways for comparisons, BL20 vs TBL20; TBL20 vs TBL20_24 h_BW720c; TBL20 vs TBL20_48 h_BW720c were selected from the top 12 defined in each comparison. Top chart, BL20 compared to TBL20; middle chart, TBL20 at 24 h BW720c compared to TBL20 control; bottom chart, TBL20 at 48 h BW720c compared to TBL20. The significance of the enrichment is indicted in each case (-log(p value).

