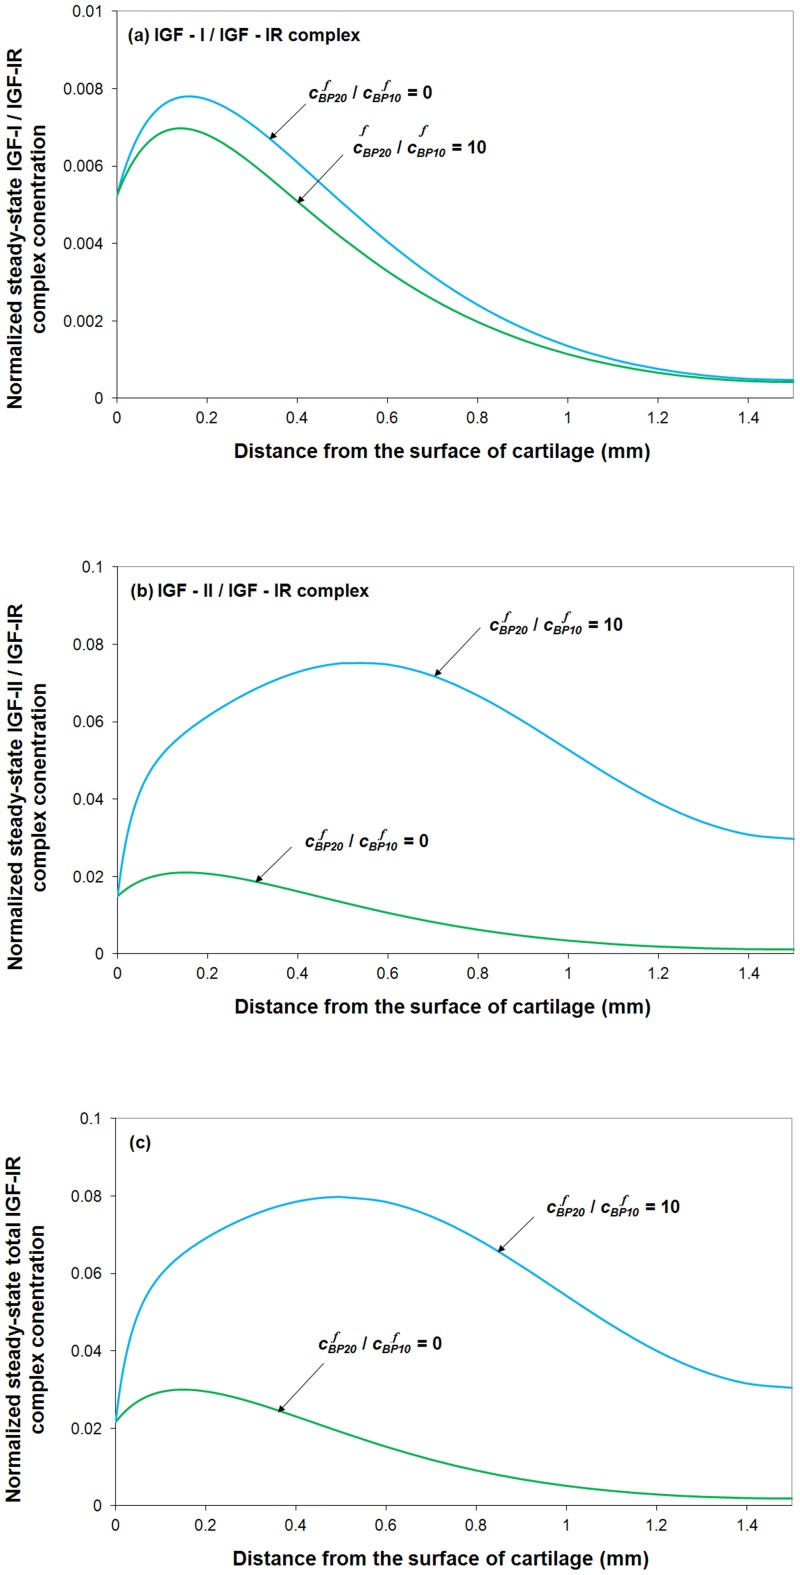
Figure 8. Steady-state IGF-I/IGF-IR, IGF-II/IGF-IR complex and total IGF-IR concentration under various ratios of two functional IGFBP groupings in synovial fluid. The calculated complex concentrations are normalized to total receptor concentration (i.e. cRT0 = 0.6 nM).
Free IGF half-life = 20 min, free IGFBP half-life = 100 min, mass transfer coefficient kBP = kSC = 5.5×10⁻⁸ m/s, and  = 0.066 nM.

