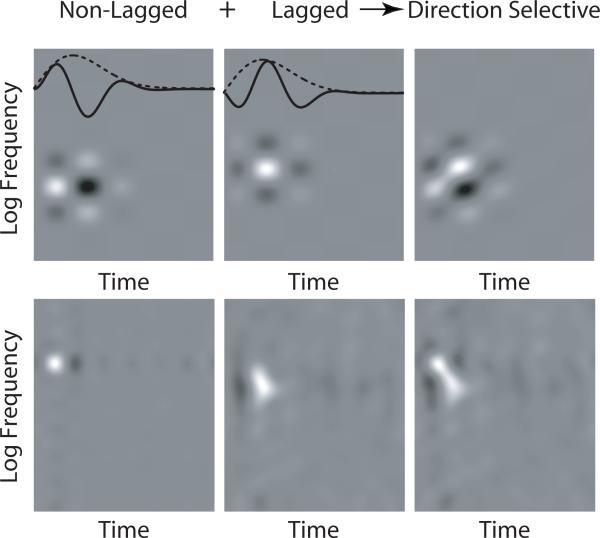
Figure 3.
Comparison to Tonal Response Latency. We plot tonal response latency as a function of biphasic index (top left), phase of the STRF temporal profile (top right), and STRF peak latency (bottom left). Lagged cells are represented by ‘o’ and non-lagged cells are represented by ‘x’. The marginal distributions of tonal response latency for lagged and non-lagged cells are shown (bottom right). There is no significant correlation between tonal response latency and biphasic index, temporal phase, or STRF peak latency (r2 ≤ 0.03, values shown), nor is there any significant difference between tonal response latencies for lagged and non-lagged cells (KS test p > 0.15). This suggests that the lagged profile results from longer latency feedback measured in steady-state, as opposed to being a feed-forward property of the ascending projections. Note that temporal phase is periodic with π = –π.

