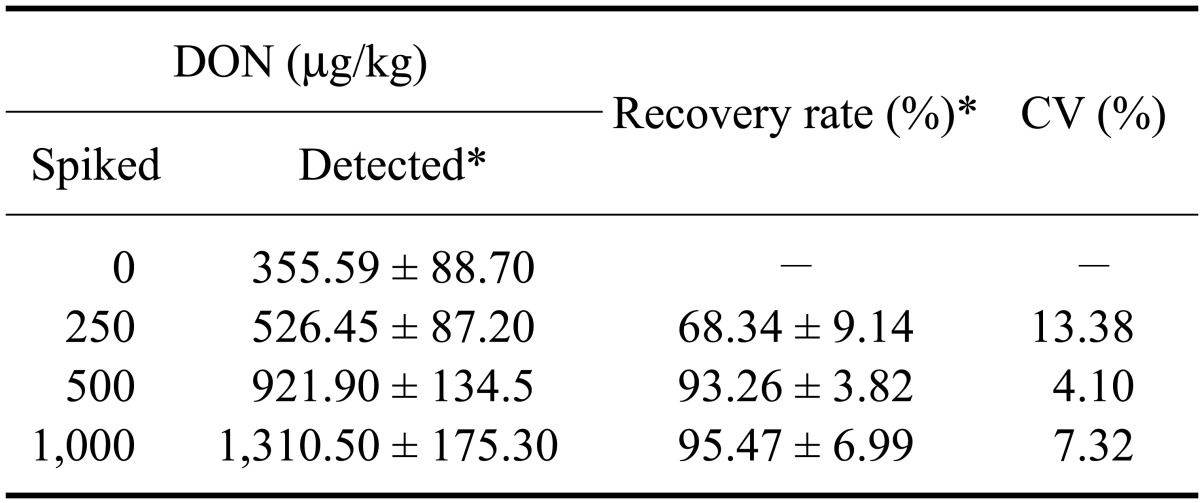
Table 3.
Recovery of DON from spiked feed samples with the DON-mAb coated ELISA

*Data are presented as the mean ± SD. To measure recovery rates, the amount of DON in the blank feed samples was deducted from that in each of the spiked samples (n = 3). CV: coefficient variation.
