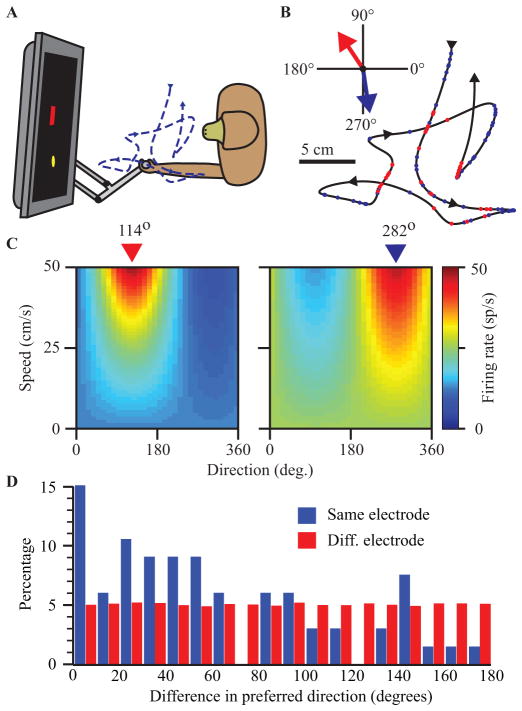
Fig. 2.
(A) Experimental setup for monkey experiments. (B) Hand trajectory during sequential random target task. Red and blue dots indicate firing of two neurons with PDs as indicated by colored arrows. Panels in (C) show the full tuning curves for two example neurons shown in (B) with PDs highlighted. (D) Differences in neuron preferred direction measured for pairs recorded from a single (blue) or across multiple (red) electrodes.

