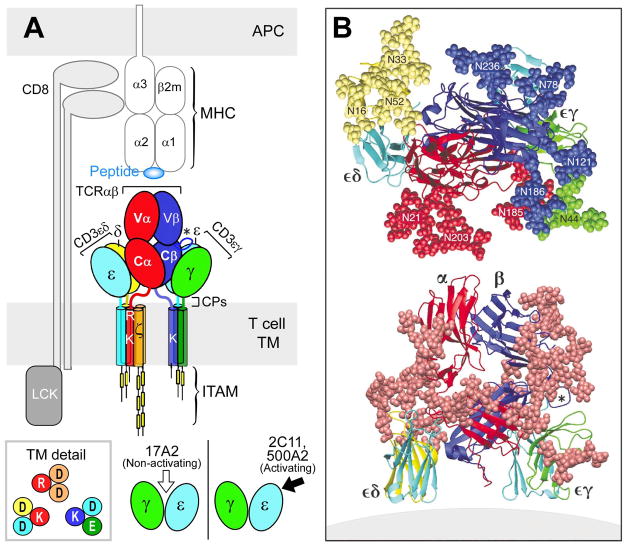
Fig. 9. TCR complex interaction with pMHC.
(A) TCR components (ectodomains, stalk CP, TM, and cytoplasmic tails) are labeled and shown in distinct colors. The pMHC on the APC and the interacting CD8αβ heterodimer are not colorized. The relative positions of the positively charged residues in TCR α and β TMs are shown and putative interactions with CD3 acidic residues indicated (boxed insert). In the bottom right insert, arrows denote direction of mAbs binding to CD3εγ relative to the T cell membrane. The view shown is a 90° Y-axis clockwise rotation relative to (A) above. (B) Ectodomain structure in ribbon form based upon PDB code IFND, 1XMW and 1JBJ are shown from the perspective of pMHC (top) and side (bottom) views with the position of T-cell membrane shown in the latter. In the top view, adducted glycans in CPK visualization are colored according to subunit whereas all sugars are denoted in beige in the side view. The FG loop is labeled by an * in each panel.

