Figure 4.
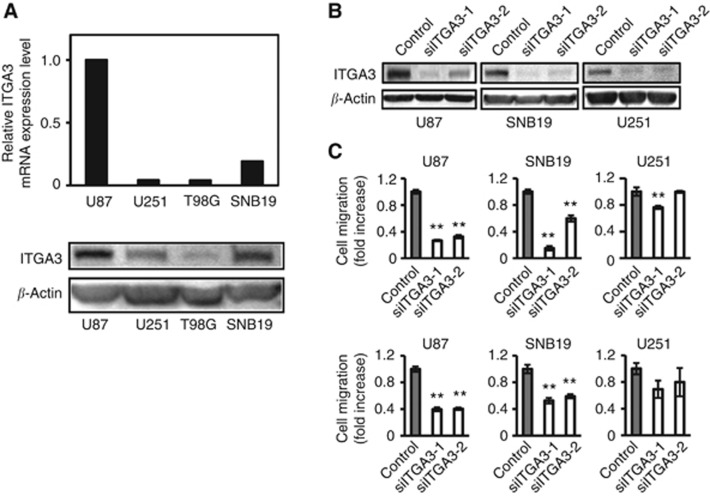
Analysis of cell migration of glioma cell lines with knock down of integrin α3. (A) The relative mRNA expression levels of integrin α3 (ITGA3) were calculated by quantitative RT-PCR. The value in U87 cells was taken as 1. Extracts of U87, U251, T98G, and SNB19 cells were immunoblotted with antibodies against integrin α3 (ITGA3) or β-actin. (B) Extracts of U87, SNB19, or U251 cells treated by siRNA for integrin α3 (siITGA3-1 and siITGA-2) or control luciferase (control) were immunoblotted with antibodies against integrin α3 (ITGA3) or β-actin. (C) Cells treated by siRNA were plated on membranes coated with fibronectin (upper panel) or laminin (lower panel) in a chemotaxis chamber. Cells migrated to the underside of membrane for 6–8 h, and the migrated cells were stained with Diff-Quick and the absorbance measured at 490 nm as described in the Materials and Methods section. The mean absorbance (490 nm) value from mock cells in each cell line is shown as 1. Bar: mean±s.e. (n=6). Double asterisks indicate a significant difference from the control at a P-value of <0.01.

