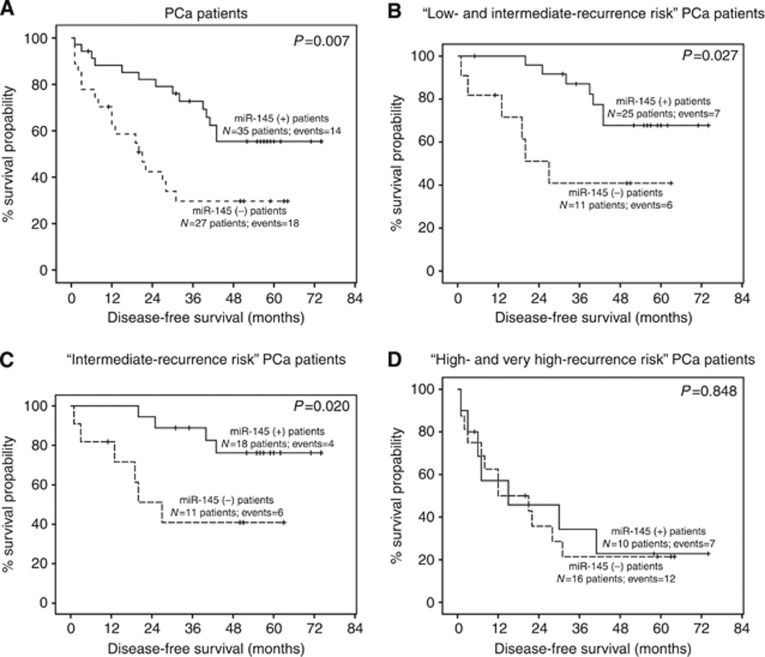
Figure 3.
Kaplan–Meier survival curves for the DFS of PCa patients (A), low- and intermediate-recurrence risk PCa patients (B), intermediate-recurrence risk PCa patients (C) and high- and very high-recurrence risk PCa patients (D) comparing with miR-145 expression levels. P-value was calculated by ‘log-rank test'.

