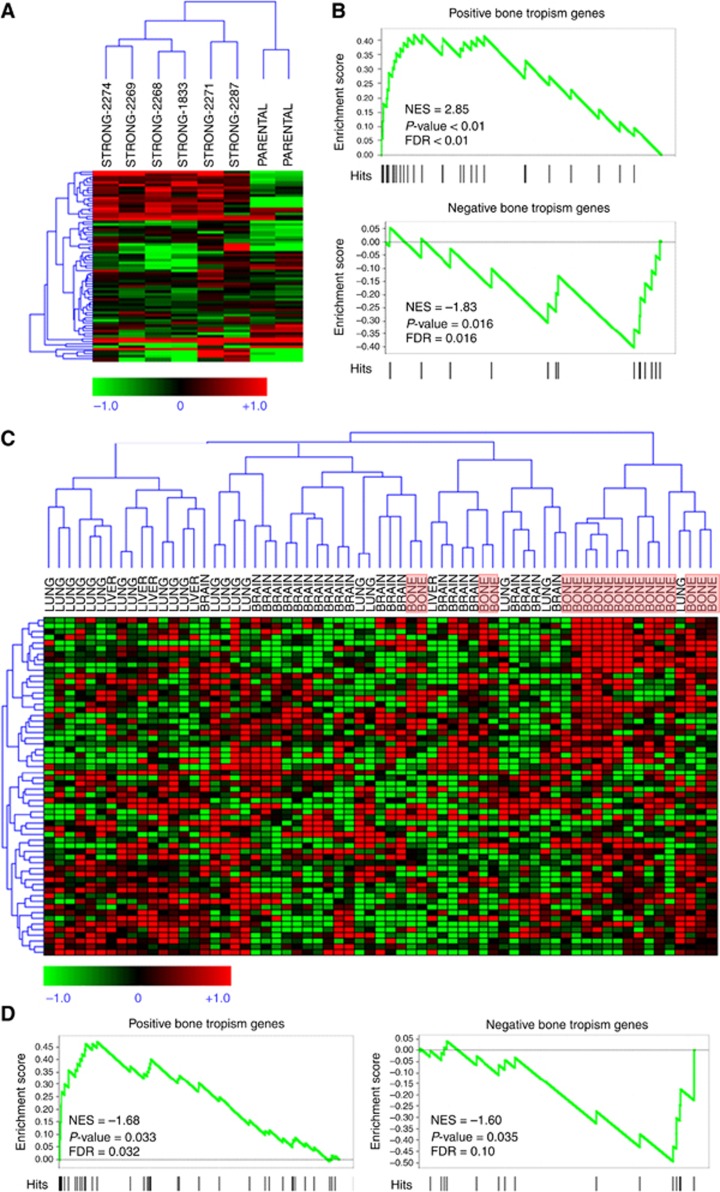
Figure 8.
Microarray analysis of breast CSCs-like bone tropism signature. (A) Hierarchical clustering of human breast cancer cell lines with strong bone metastatic potential derived by parental lines in Kang et al (2003) data set, using our CSCs-like bone tropism signature composed of 110 genes (119 probes). (B) Gene set enrichment analysis samples of Kang et al (2003) for enrichment of the CSCs-like bone tropism signature in genes that discriminate bone metastatics from parental lines. Upper panel: positive signature genes are significantly high in cells with strong metastatic potential. Lower panel: negative signature genes are significantly low in strong metastatic potential. (C) Hierarchical clustering of 65 breast cancer samples from metastatic lesions at different sites in a published data set, using our CSCs-like bone tropism signature. For convenience, bone metastasis samples are highlighted by light red boxes. A subset of signature genes with significantly high expression in bone metastases is evident in the top right corner. (D) The GSEA analysis on the metastasis samples for enrichment of the breast CSCs-like bone tropism signature in genes that discriminate bone metastases from lesions at other sites. Left panel: positive signature genes are significantly high in bone metastases. Right panel: negative signature genes are significantly low in bone metastases. FDR, false discovery rate; NES, normalised enrichment score.

