Figure 1.
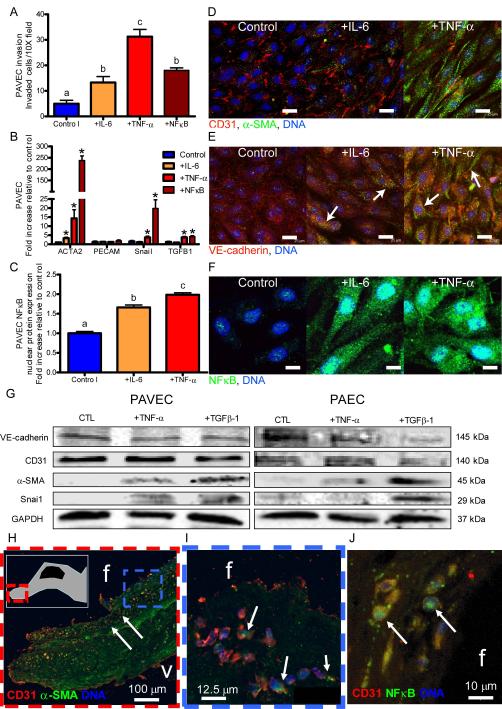
Exposure to inflammatory cytokines induces mesenchymal transformation in adult endothelial cells. A.) Porcine aortic valve endothelial cell (PAVEC) mesenchymal transformation and invasion of the collagen matrix after 48 hour exposure to 100 ng/mL IL-6, 100 ng/mL TNF-α, or genetic overexpression of NFκB. B.) PAVEC EndMT-related gene expression after 48 hour exposure to 100 ng/mL IL-6 or TNF-α, or genetic overexpression of NFκB C.) PAVEC NFκB nuclear localization quantification. D.) Confocal images of control, +100 ng/mL IL-6, and +100 ng/mL TNF-α PAVEC at a 48 hour time point stained for CD31 (red), α-SMA (green), and DNA (blue). E.) Confocal images of control, +100 ng/mL IL-6, and +100 ng/mL TNF-α PAVEC at a 48 hour time point stained for VE-cadherin (red), α-SMA (green), and DNA (blue). F.) Confocal images of control, +100 ng/mL IL-6, and +100 ng/mL TNF-α PAVEC at a 48 hour time point stained for NFκB (green) and DNA (blue). G.) Western blots for PAVEC and porcine aortic valve endothelial cells (PAEC) exposed to 100 ng/mL TNF-α or TGFβ-1 for 48 hours. H.) Diseased human aortic valve endothelial cells co-expressing α-SMA and CD31 (on the fibrosa or outflow side and invaded, calcified nodule shown in inset, I.) Expanded frame of Figure 1H. J.) Nuclear translocation of NFκB in diseased human valve endothelial cells. Error bars show ±SEM, n ≥ 3 culture wells. Bars that do not share any letters are significantly different according to a one-way ANOVA with Tukey’s post test (p ≤ 0.05). For EndMT gene expression (Figure 1B), differences that are significantly different than the control according to an unpaired Student’s t-test are indicated with a *. Differences were considered significant at p ≤ 0.05. Scale bars = 25 μm (D, E) or 10 μm (F).

