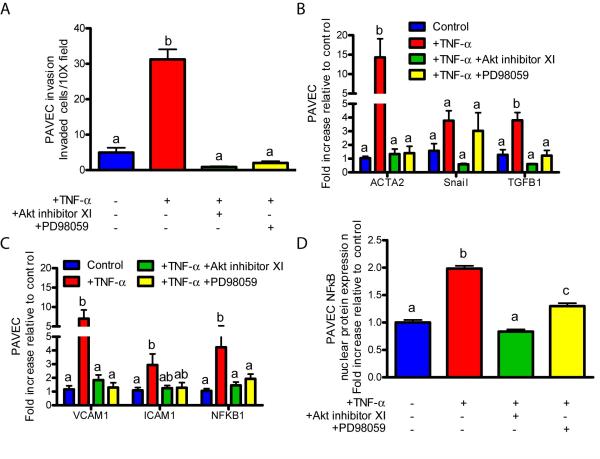
Figure 3.
Inflammatory cytokines induce EndMT through Akt/MAPK/NFκB in PAVEC. A.) Cell invasion after a 48 hour to exposure to 100 ng/mL TNF-α or 100 ng/mL TNF-α with 5 μm Akt inhibitor XI or 25 μm PD98059 MEK1 inhibitor. B.) EndMT-related gene expression after a 48 hour exposure to 100 ng/mL TNF-α with inhibitors. C.) Inflammatory activation-related genes after a 48 hour exposure to 100 ng/mL TNF-α with inhibitors. D.) PAVEC NFκB nuclear localization quantification after a 48 hour exposure to 100 ng/mL TNF-α with inhibitors. Error bars show ±SEM, n ≥ 3 culture wells. Bars that do not share any letters are significantly different according to a one-way ANOVA with Tukey’s post test (p ≤ 0.05).

