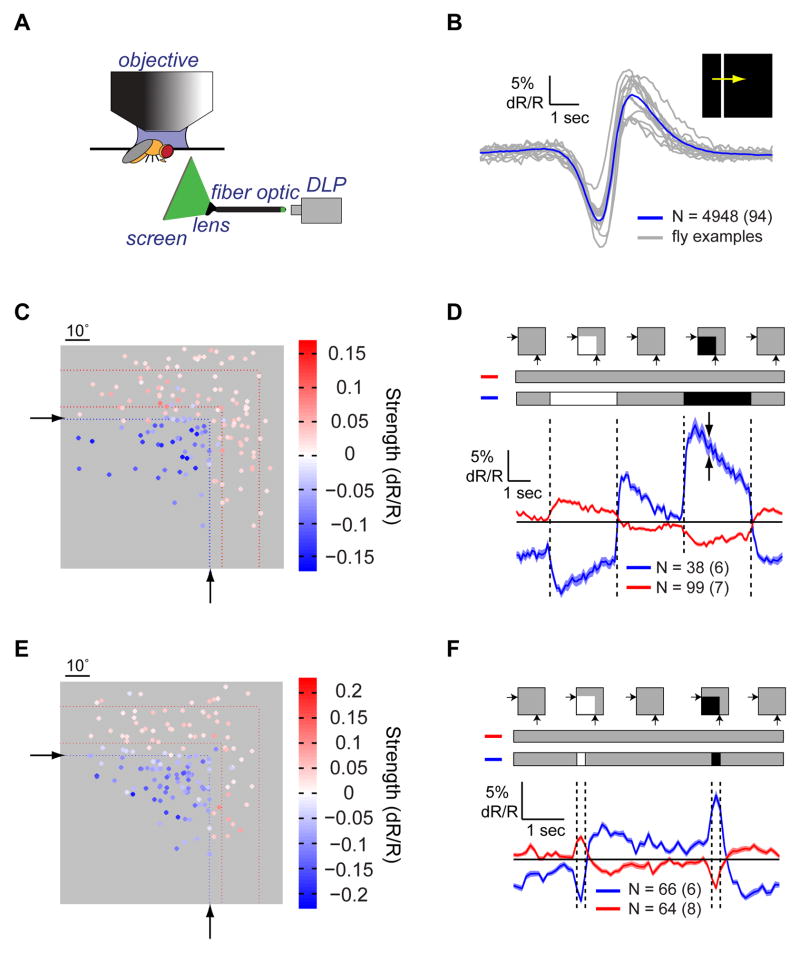
Figure 1. Lateral inhibition shapes L2 cell responses to light.
(A) Schematic illustration of the imaging set-up. DLP = Digital Light Projector. (B) Mean response of all L2 cells (blue) and average responses from a few example flies (gray) to a bright bar moving on a dark background. N denotes the number of cells, with the number of flies denoted parenthetically. Shading denotes +/− 1 SEM (standard error of the mean). (C and D) The response of L2 cells to a partial field flash. (C) Heat map of response strengths as a function of the RF center location on the screen, indicated by dots. Colors indicate the strength and sign of the corresponding cell response. Only cells with response strengths >0.025 or <−0.015 are presented. Black arrows and blue dotted lines denote the region of the screen where the flash was presented. Red dotted lines denote the region of the screen where surround responses in (D) were observed. (D) Mean response of L2 cells to the flash presentation, separated by polarity and position. Blue - cells within the flash presentation region, which hyperpolarized to light; red - cells outside of the flash presentation region, which depolarized to light. Shading denotes +/− 1 SEM (highlighted by the two arrows). Top: schematic description of the stimulus, including the contrast inputs into each group of cells. (E and F) Same as (C) and (D) for cells responding to a 200 ms flash presentation, including only cells with response strengths larger than a 0.02 threshold. See also Figure S1.

