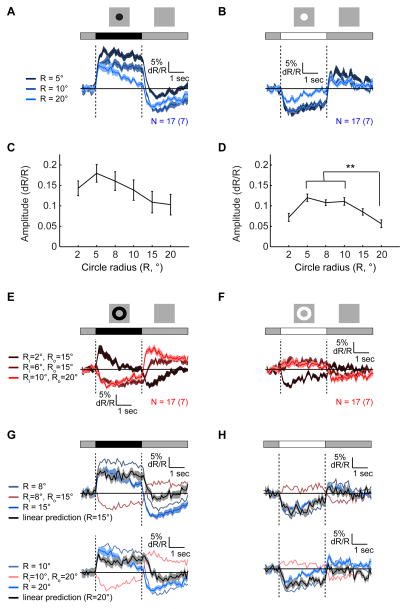
Figure 2. Responses to circles and annuli reveal the spatial shape of the RF.
Mean responses to dark ((A) and (E)) and bright ((B) and (F)) circles (blue traces, (A) and (B)) and annuli (red traces, (E) and (F)) of different sizes presented for 3 s on an intermediate illumination level background, around identified RF centers. Shading here and in ((G) and (H) denotes +/− 1 SEM. (C and D) Mean amplitudes of responses to dark (C) and bright (D) circles, as a function of the radius, R. ** a significant difference between the two means by one-way anova, according to Tukey’s honestly significant difference criterion (D). Error bars denote +/− 1 SEM. (G and H) Comparing predicted responses (black continuous traces) to measured responses (blue continuous traces) to the presentation of a 15° circle (top) and a 20° circle (bottom), assuming linearity, as a sum of responses to circles and annuli of appropriate sizes. Dark stimuli responses (G), bright stimuli responses (H). See also Figure S2.

