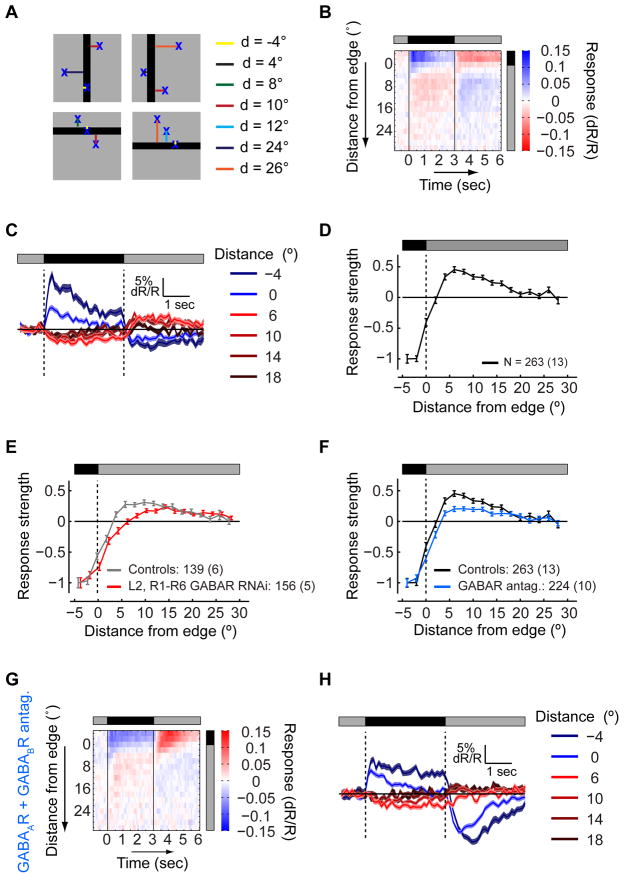
Figure 6. GABA receptors in photoreceptors contribute to the inhibitory surround.
(A) Schematic illustration: a dark bar is presented at a random position on a background of intermediate illumination, while responses are aggregated by the distance of RF centers from the bar’s edge. Negative distances correspond to RF centers within the bar. (B) The mean response of L2 cells as a function of the distance of the RF center from the bar’s edge and the bar presentation time. Response (dR/R) values encoded as described by the color scale. (C) The mean response to the presentation of the bar at different distances between the RF centers and the bar’s edge, as a function of time. Blue - mean responses of cells with RF centers within the bar presentation region, red - mean responses of cells with RF centers outside the bar presentation region. Shading denotes +/− 1 SEM. (D) Mean response strength as a function of the distance from the bar’s edge, normalized to the strength at a distance of 4°, within the bar. Negative strength values correspond to depolarization during the bar presentation, positive values to hyperpolarization. Error bars denote +/− 1 SEM. (E and F) The effects of manipulations on the mean response strength as a function of the distance from the bar’s edge. (E) Gray - controls, TN-XXL expressed in L2 and in R1–R6 photoreceptors; red - experiment, knockdown of GABAARs and GABABRs in L2 and R1–R6 photoreceptors. (F) Same as (E), black - controls, TN-XXL expressed in L2 cells only; blue - experiment, application of GABAAR and GABABR antagonists. (G and H) Same as (B) and (C), following application of GABAAR and GABABR antagonists. See also Figure S6.

