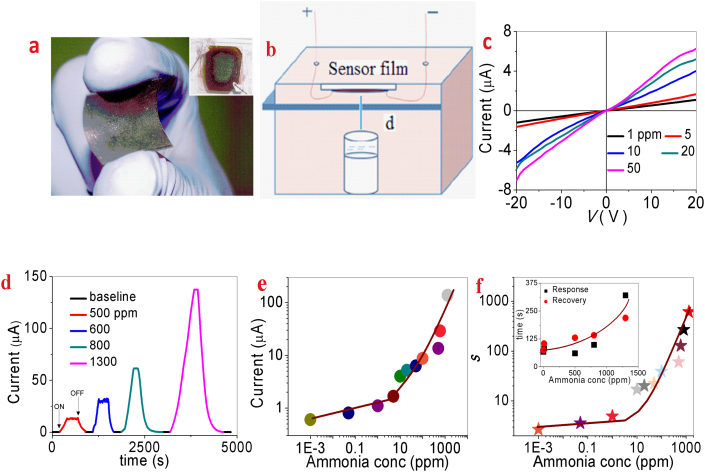
Figure 1. Ammonia sensing of GG/Ag film I.
(a) Optical micrograph of the film on a flexible substrate. Optical micrograph of the film with electrical leads is shown in the inset. (b) Schematic representation of the experimental set up. The distance from the source to film is 1 cm. (c) Current-voltage characteristics with different ammonia concentrations. (d) Temporal response to different ammonia concentrations for an applied voltage of 20 V. Ammonia ON and OFF are indicated by arrows. (e & f) Current and sensitivity as a function of ammonia concentration in log-log plot. Response time and recovery time are shown in the inset. Solid lines are guide to the eye.

