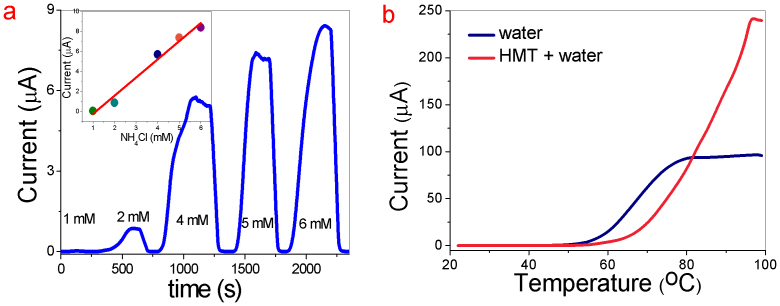
Figure 5. Ammonia evolution from chemical reaction.
(a) Temporal response of ammonia evolution for different NH4Cl concentrations (1, 2, 4, 5, 6 mM). Current as a function of NH4Cl concentration is shown in the inset. (b) Ammonia evolution from HMT as a function of temperature. The current is measured at a constant bias of 20 V.

