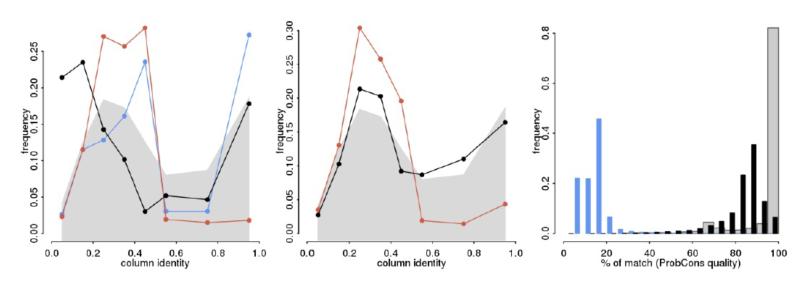
Figure 4.
Distribution of pairwise identities and percentage of correct matches (as given by ProbCons) per alignment column for simulated and real data sets. On the left we have the distribution of column-wise identities over all simulations - that is, under short Independent Origins (IO) trees and under large Universal Common Ancestry (UCA) scenarios. The gray background indicates the equivalent frequencies for Theobald’s BE data set. The middle panel shows the same information as the left one, but here all trees were simulated under branch lengths compatible to those for Theobald’s BE data set. The right panel is the histogram of quality values per column as given by ProbCons for all simulations, together with the values for the observed BE data set. The colors are the same as Figure 3 (blue for aligned IO and black for UCA), with gray columns indicating Theobald’s BE data set.

