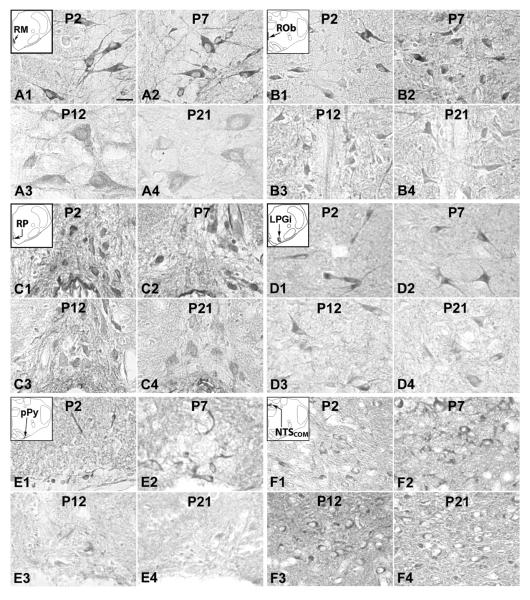
Fig. 4.
Serotonin transporter (SERT) expression in neurons of the RM (A), ROb (B), RP (C), LPGi (D), pPy (E), and NTSCOM (F) at P2 (A1–F1), P7 (A2–F2), P12 (A3–F3), and P21 (A4–F4). The insets in A1–F1 indicate the locations of each nucleus in a diagrammatic cross section of the medulla or pons. SERT expression in the RM, ROb, RP, LPGi, and pPy were relatively high at P2 and P7, but were much lower at P12 and P21; On the other hand, the level in NTSCOM was quite stable from P2 to P21. Scale bar: 20 μm for all.

