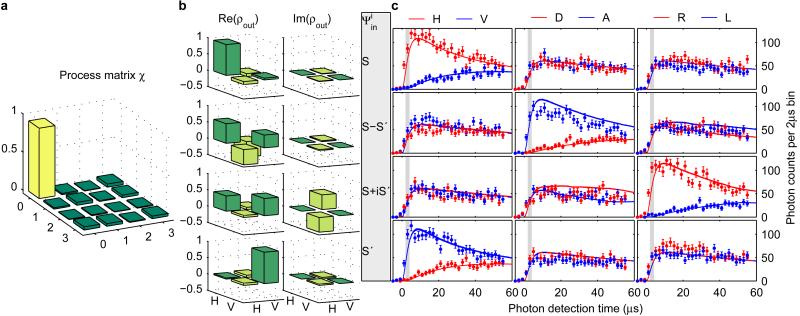
Figure 2. Process and state fidelities of the ion–photon mapping.
a, Absolute values of the process matrix χ reconstructed from cavity photons detected between 2 μs and 4 μs after the bichromatic field is switched on at time = 0. b, Reconstructed density matrices of photons in the same time window for the four input states |S , |S–S′
 , |S+iS′
 , and |S′
 , shown in rows from top to bottom. c, Each state tomography corresponds to measurements in the three bases H/V, D/A, and R/L (columns). For each input state, the temporal shapes of single photons are plotted in red for polarizations H, D, R and in blue for polarizations V, A, L. Error bars represent one s.d. based on Poissonian statistics. In each row, in two of three columns, photons are equally distributed over both detectors, while in the third, photons are generated ideally with a single polarization. Master-equation simulations (red and blue lines) successfully reproduce the observed dynamics. The grey shaded area indicates the time window used for tomography.

