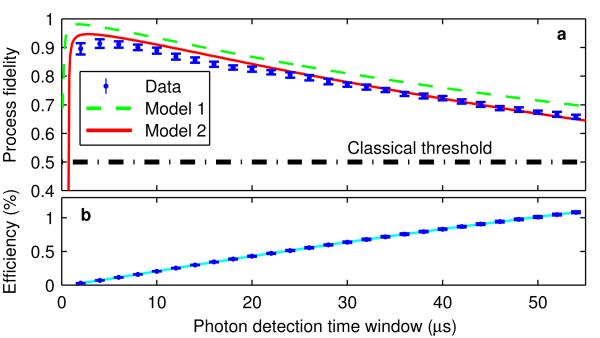
Figure 3. Time dependence of process fidelity and efficiency.
a, Cumulative process fidelity and b, process efficiency are plotted as a function of the photon-detection time window, where error bars represent one s.d. (See Supplementary Information.) A green dashed line indicates the simulated process fidelity for the same parameters as in Fig. 2. To this model, we now add the effects of detector dark counts, imperfect state initialization, and magnetic-field fluctuations, quantified in independent measurements, with the result indicated by a red line. A fit to the process efficiency is used to weight the effect of dark counts. The second model agrees well with the data, while the first one represents achievable values for this ion–cavity system.

